The decline from the May top, and the subsequent sideways chopping have been hard on investors' nerves as they try to decide how things will eventually resolve; however, even though the rising trend line has been challenged twice in the last few months, the technical picture has been steadily improving. Also, sentiment indicators have been persistently and strongly pessimistic – some even worse than at the 2002 bear market lows – and this is bullish for the market.
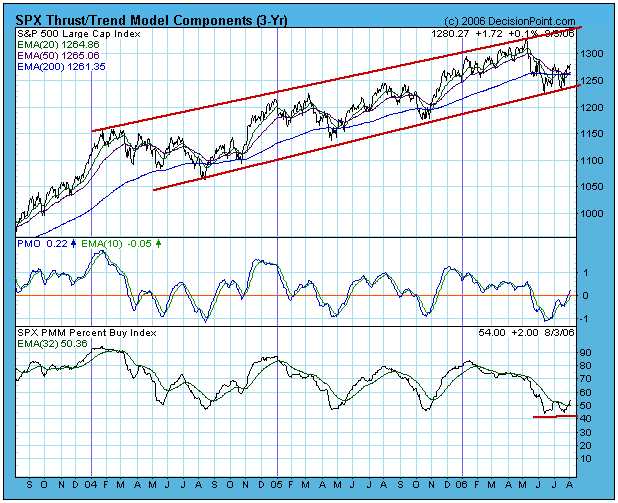
The first chart shows the components of our Thrust/Trend Model, our primary timing tool. (A full discussion of this model can be found in the Glossary section of the DecisionPoint.com website.) The first thing we can see is the bullish double bottom that was formed as the price index was challenging the bottom of the rising trend channel. What remains to be seen is a decisive break above the middle peak of the "W", but the price pattern is positive nevertheless.
Until recently the model has been in neutral because the Percent Buy Index (PBI) has been below its 32-EMA, but, as you can see, the PBI has also formed a double bottom and has recently broken above its 32-EMA, switching the model to a buy signal. Also, the PBI, like most of our other medium-term indicators, is rising out of oversold conditions. The chart looks very positive.
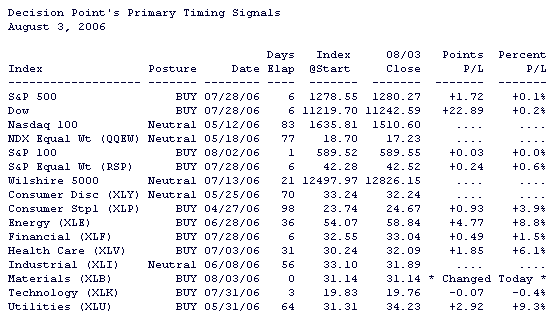
The model shown is for the S&P 500 Index, which gives us our positioning for the broad market, but we also apply the model to other market and sector indexes. As you can see in the table below, buy signals are being generated across a wide range of indexes and sectors.

This table is updated daily in the Decision Point Alert Daily Report.
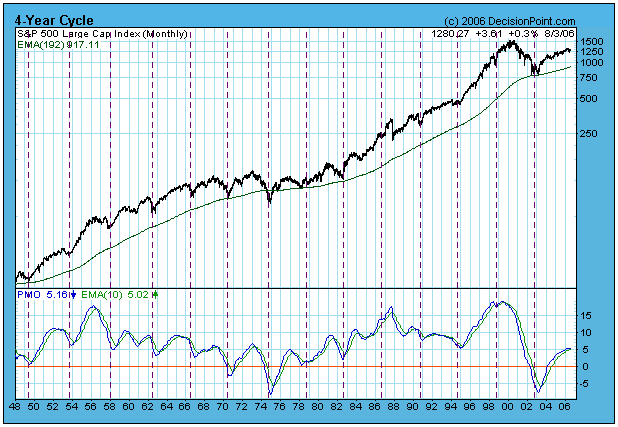
No matter how positive things may look, there is always something to worry about. For me it is that we are overdue for a bear market, and we are also due for a price trough associated with the 4-Year Cycle. As you can see by the chart below, the 4-Year Cycle is pretty reliable in attracting price lows, and based on the history shown on the chart, there is about an 80% chance that prices will be lower later this year (and about a 20% chance that they won't).

Also, it is not easy to see on the chart, but the monthly PMO has topped and has been falling for three months.
Bottom Line: Actions taken by the Fed next week could torpedo my conclusions, but the most objective evidence we have shows that the market is configured for another advance, and this is backed up by the more subjective pessimism reflected in most sentiment indicators. On the other hand, if the models have been tricked by the market, they will normally turn neutral with only minor loses; however, stops should be used to guard against negative price action that is too rapid for the models' reaction time.

