ChartWatchers November 18, 2006 at 11:05 PM
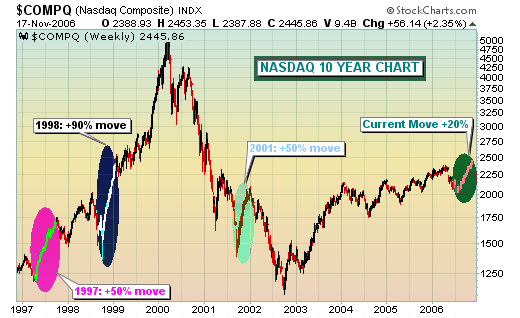
Not very likely. We've seen a very strong earnings season. Economic report after economic report suggests the Fed is done with its interest rate hike campaign. There are too many non-believers in the market's advance, just take a look at the short-sellers... Read More
ChartWatchers November 18, 2006 at 11:04 PM
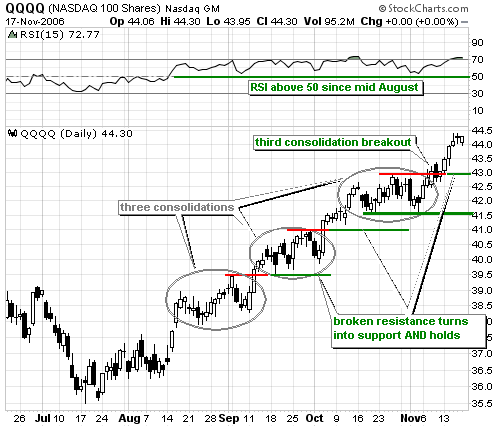
For the third time in three months, QQQQ broke consolidation resistance and the uptrend shows no signs of abating. The gray ovals show consolidations in the second halves of August, September and October... Read More
ChartWatchers November 18, 2006 at 11:03 PM
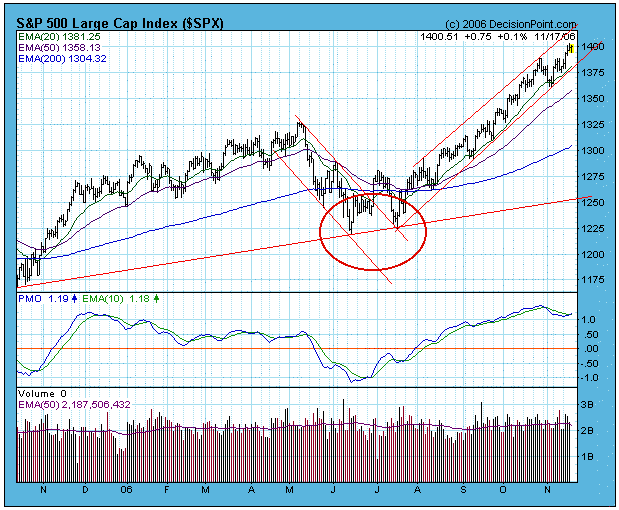
For quite a while I have been saying that the rally that began in July has been driven by persistent bearishness among investors... Read More
ChartWatchers November 18, 2006 at 11:02 PM
UPDATED CANDLEGLANCE PAGE - We've upgraded the Candleglance page so that people with wide screens will see more charts and less white space. Look for similar improvements throughout our site in the coming weeks... Read More
ChartWatchers November 18, 2006 at 11:01 PM
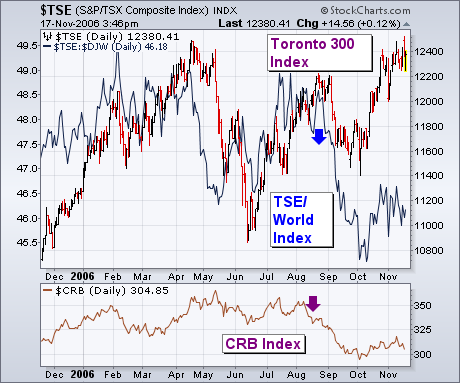
FALLING COMMODITIES HURT CANADA ... When commodity prices started to slide several months ago, I suggested that certain global stocks markets might suffer from falling raw material prices. One of them was Canada... Read More
ChartWatchers November 18, 2006 at 11:00 PM
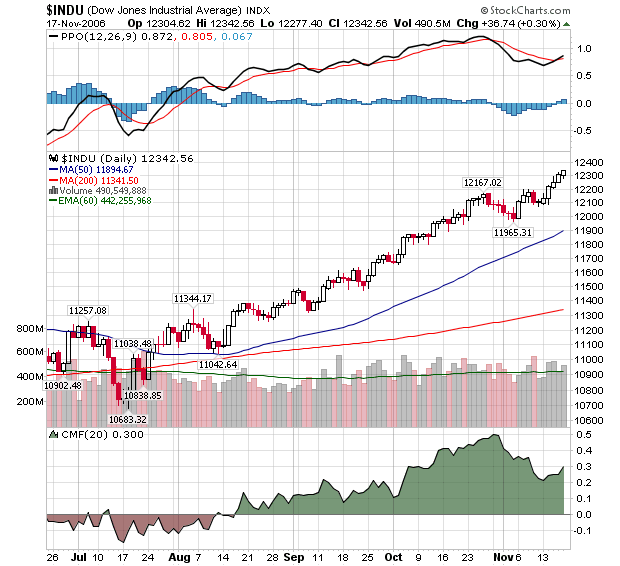
Here's what a strong techincal picture looks like: Record closes for each of the past 4 days. Steady volume. Increasing Money Flow values. Quick recovery from a recent downturn. Bullish MACD cross-over. This chart has it all! Unless... Maybe too many good signs is a bad sign... Read More
ChartWatchers November 04, 2006 at 11:06 PM
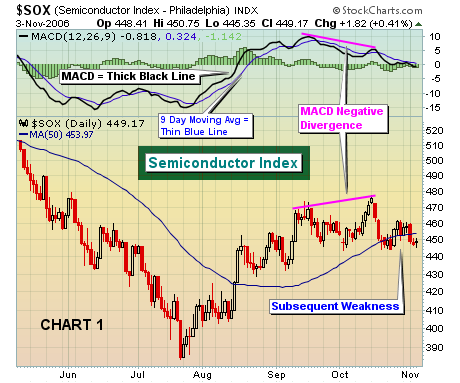
On the technical side, we believe the combination of price and volume is paramount to successfully trading the stock market. A strong second place finish goes to the Moving Average Convergence Divergence, or the "MACD". The standard settings on the MACD are 12, 26, 9... Read More
ChartWatchers November 04, 2006 at 11:05 PM
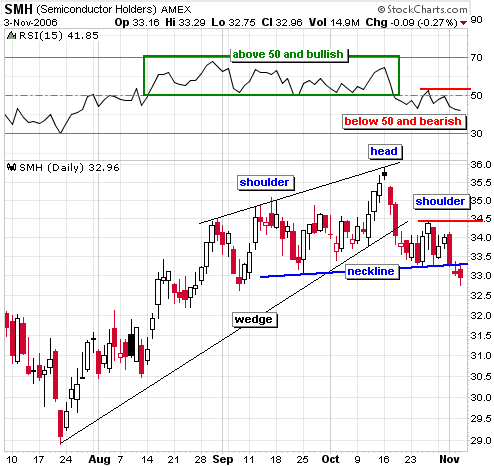
The Semiconductor group is important to the performance of the Nasdaq and the Nasdaq is important to the performance of the overall market... Read More
ChartWatchers November 04, 2006 at 11:04 PM
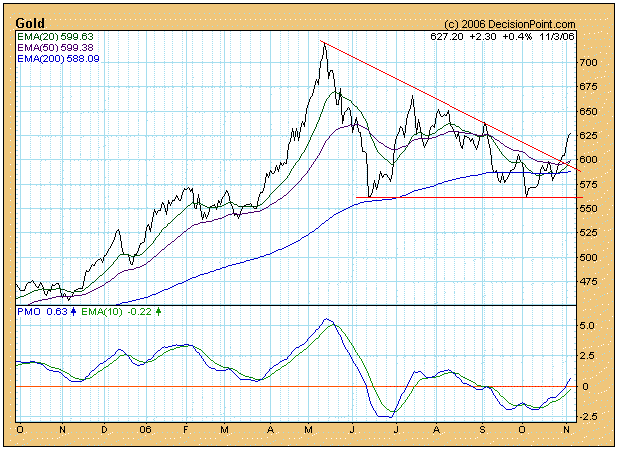
Since gold peaked around $725 in May of this year, it has been going through the process of digesting the huge advance that took place a year prior to that peak... Read More
ChartWatchers November 04, 2006 at 11:03 PM
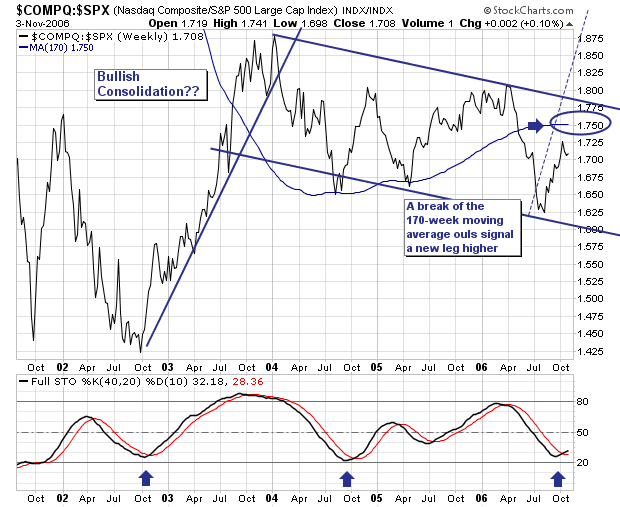
The broader market rally off the June/July lows has pushed all the major indices higher; and in particular the Nasdaq Composite has outperformed rather noticeably if one looks at the Composite/S&P 500 Ratio. It has moved from 1.625 to 1... Read More
ChartWatchers November 04, 2006 at 11:02 PM
Our servers are now safely relocated to their new (temporary) home and the construction of our new server room has begun... Read More
ChartWatchers November 04, 2006 at 11:01 PM
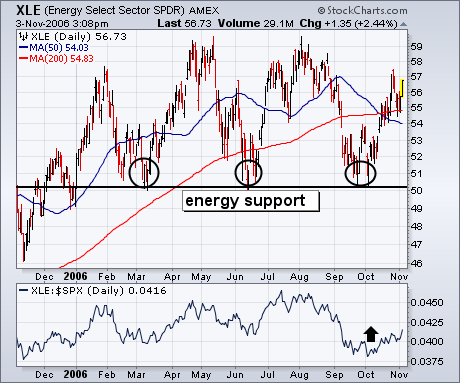
The last time I showed the Energy Sector SPDR (XLE) it was starting to bounce off chart support along its 2006 lows (see circles). Chart 1 shows that the XLE has climbed back over its moving average lines and may be heading toward the top of its 2006 trading range... Read More
ChartWatchers November 04, 2006 at 11:00 PM
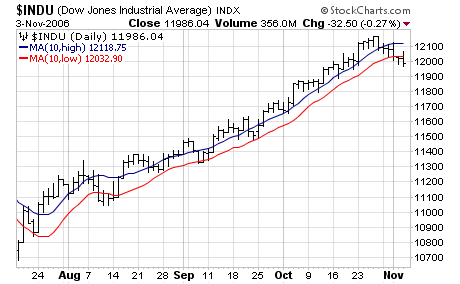
There is a lot more power inside our SharpCharts2 charting engine than we currently make available to our users. The problem is making that power available in an easy-to-use way... Read More