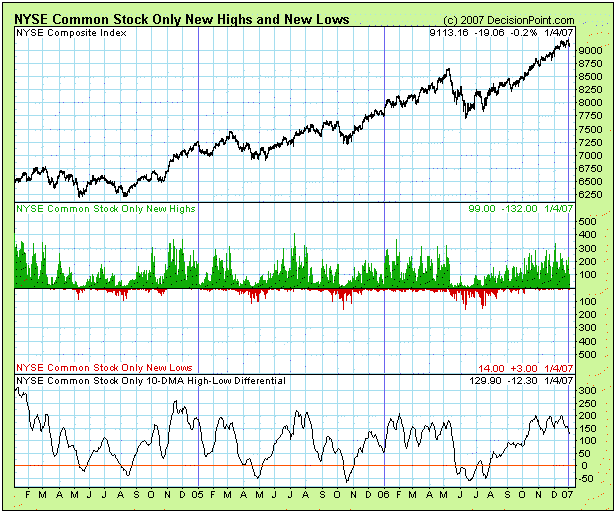
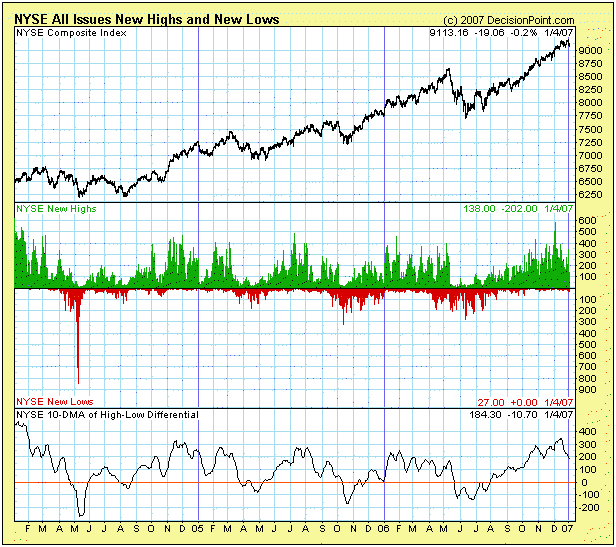
The purpose of this article is to introduce a new set of market indicators that DecisionPoint.com has recently released, indicators constructed from only common stocks listed on the NYSE.
A little background, at its inception The NYSE Composite Index was composed of all the issues listed on the New York Stock Exchange. The approximately 3,500 components were cap-weighted by total shares outstanding, and the NYSE Composite was one of the dullest indexes in existence. In January 2003 this all changed in a major way. The composition of the index was changed to include only common stocks listed on the NYSE (approximately 2,050), and they are cap-weighted based on the float (the shares available for trading). The result has been that the new NYSE Composite is now one of the top performing broad market indexes. For example, during the rally that launched off the July 2005 lows, the NYSE Composite had gains second only to the Nasdaq 100 Index.
When the NYSE Composite was reconstituted in January 2003, the NYSE failed to publish statistical breadth and volume data related to only the 2,050 components on the index. Rather, the NYSE and all media sources continued to publish data based all the 3,500 issues listed on the exchange, and most technicians (me included) continued to use these flawed data to construct indicators for the NYSE Composite. It was, after all, the only data available, but the resulting indicators had to be taken with a grain of salt. Let me explain why.
The NYSE Composite components are only common stocks, whereas the approximately 1,500 issues excluded from the Index are mostly not common stocks and are primarily issues sensitive to interest rates. By using data from all NYSE issues listed, indicator results are being contaminated by 1,500 issues that are totally unrelated to the Composite Index, and that often behave as a group in a manner completely different from the 2,050 index components. As a consequence, market indicators generated from this questionable data must necessarily be considered somewhat unreliable.
In late-2005 we decided to fix this problem. Since we track the list of NYSE Composite component stocks, we began collecting these Common Stock Only (CSO) data, and we developed a standard set of indicators based upon it. We also back-calculated the raw data and indicators back to January 2003. We have just released the new set of 10 indicators to our subscribers. If I may be allowed for a moment to be humility-challenged, the release of these indicators is a very big deal for many technical analysts. The scarcity of the raw data means that few services can offer these indicators, and some of these indicators are only available from DecisionPoint.com.
Is there any real difference between the Common Stock Only (CSO) indicators and those based upon All NYSE Issues? Yes, there are many differences, ranging from subtle to significant. Let's look at New High New Low charts as an example. Obviously, the CSO highs and lows have a smaller range because there are fewer stocks involved, but one difference that really stands out is the huge down spike of All Issues New Lows in May 2004, whereas, the CSO version shows merely a slight down blip.
Bottom Line: Whenever possible, market indicators should be constructed from data derived from the component stocks of the index to which the indicator is applied. In other words, the S&P 500 Advance-Decline Line should be constructed from the action of S&P 500 stocks. For too long NYSE Composite indicators have been corrupted by data from stocks that are not part of the NYSE Composite Index. It is with great pleasure that DecisionPoint.com has released a set of NYSE Composite indicators that are based on real NYSE Composite Index data.


