One of my colleagues has been harassing me (in a friendly way) for not yet having declared myself a bear. The truth is that top picking is a treacherous business, and I have given it up in favor of letting trend models make my declarations for me. For example, I changed from bullish to neutral (medium-term) on stocks on March 6, and some readers have wondered why I didn't go all the way to bearish instead of just neutral. The reason is that my long-term trend model must be bearish at the time the medium-term mechanical model issues a sell signal in order for me to become medium-term bearish. My long-term trend model also defines, for me, whether the market is in a bull or bear mode over all.
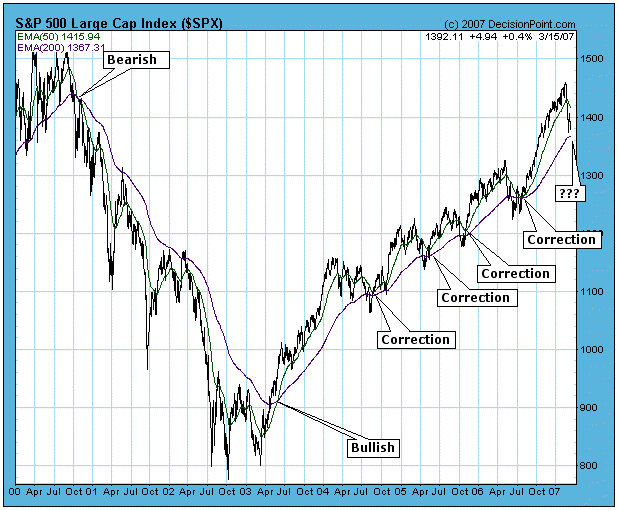
The long-term trend model is driven by the relationship of the 50- and 200-EMAs (exponential moving averages) of the price index. If the 50-EMA is above the 200-EMA, we are in a bull market, and we are in a bear market if the 50-EMA moves below the 200-EMA. In the chart below you can see that this model has performed brilliantly from late-2000 to the present. The downside crossover in October 2000 cleanly declared that a bear market was in progress, and the upside crossover in May 2003 confirmed that a bull market had begun. After that, there were four bull market corrections that caused the 50-EMA to approach the 200-EMA, but a downside crossover never happened, and the bull market, by this measure, remained in force.
Now another correction is in progress, and it has caused the 50-EMA to turn down, but, as you can see, we are a long way from a downside crossover, assuming that no major crash occurs. Until proven otherwise, I think it is safest to assume that the recent decline is a bull market correction. This doesn't mean that we have our guard totally down. Our medium-term model has us out of the market, but the long-term model prevents us from becoming aggressive on the short side.
While the long-term trend model has done well in the last six years, I should emphasize that it is not always this perfect, and it too slow to side step major crashes, like 1929 and 1987. For that we need more sensitive tools, focused in the medium-term. The long-term trend model is best used as a tool to objectively define bull and bear markets, so, for example, if someone asks me, "Is it a bear?", I can look at the chart, see that the 50-EMA is above the 200-EMA, and reply, "Not yet!"
Bottom Line: It is useful to have an objective method to define bull and bear markets, and we use simple crossover signals generated by longer-term moving averages. I do not claim that this is the best method, but it is very effective for our purposes.

