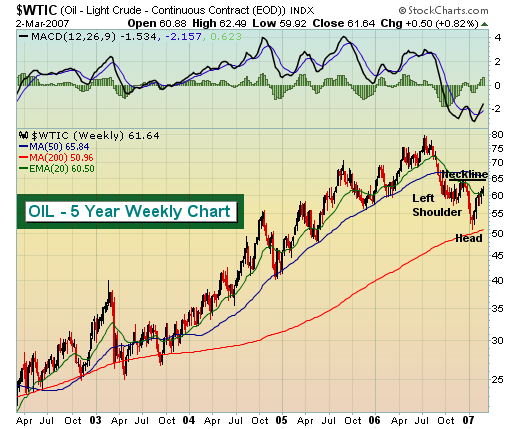
We have been in the bearish camp on energy and over the past several months and for now remain on the bearish side. But anytime you take a position on the bullish or bearish side, you need to realize patterns that could change your view. The price of oil broke a five year uptrend in 2006 that has us very cautious on the energy sector in 2007. There are circumstances and patterns that could develop to change our bearish view. Oil prices have been bouncing, from lows just under $50 per barrel to our recent highs back over $62 per barrel. Will the sudden uptrend continue or will the rally fade? No one knows the answer for sure, although there is a formidable bullish pattern that is potentially forming - the bullish inverse head and shoulder continuation pattern. Take a look at the following chart:

Off of a significant uptrend, we saw oil pull back in the fourth quarter of 2006 touching $57-$58 per barrel (inverse left shoulder). After a quick reaction bounce to $64 (first point of neckline) approaching the 50 day SMA, oil found a new low near $50 per barrel (inverse head). Now we're watching oil climb again, perhaps to test that $64 area (second point of neckline). Could we then witness one more pullback under $60 to form a potential inverse right shoulder before ultimately breaking out above $64? If that pattern develops, the breakout would measure to $78 or so, testing the highs from last summer. We realize we're getting a bit ahead of ourselves and we do not anticipate oil completing this bullish pattern. However, as a trader, you need to be able to recognize the possible bullish and bearish patterns that develop not only to maximize gains from opportunities, but more importantly, to minimize losses from mistakes. Let's watch the action unfold in the coming days and weeks and be prepared to react accordingly.
