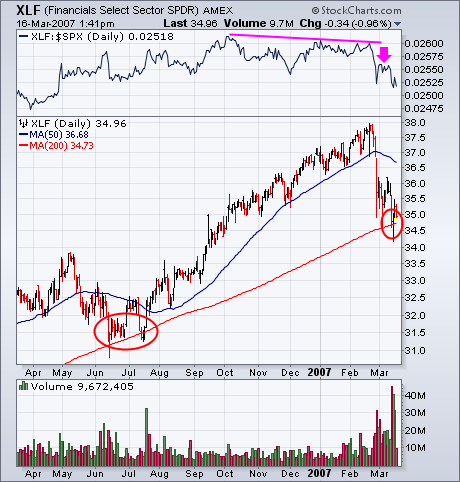
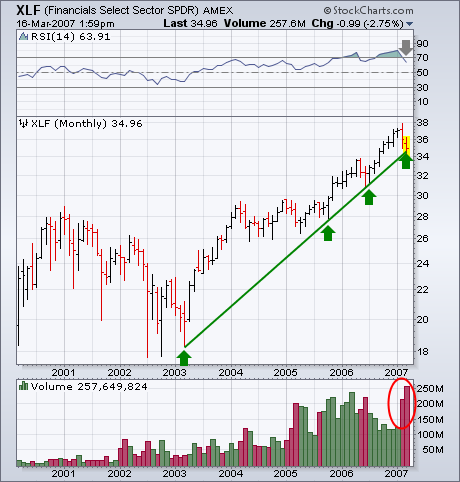
It's no secret that one of the main problems pulling the market down over the last month has been the fallout from subprime mortages. It's also no surprise to read that financial stocks (mainly banks and brokers) have been the weakest part of the market over the last couple of weeks. That's a concern because financial stocks are historically viewed as market leaders. They had been leading the market higher over the last two years. Not anymore. The line on top of Chart 1 is a ratio of the Financials Select SPDR (XLF) divided by the S&P 500. That ratio peaked in October of last year, and failed to confirm this year's move to new high ground (red arrow). Even worse, the ratio has fallen to the lowest level since last May. The group itself is now in the process of testing some long-term support lines. One is the 200-day moving average. That support line line hasn't been decisively broken for eighteen months (red circles). Chart 2 shows the XLF also testing a four-year uptrend line (drawn on a log scale). Chart 10 holds some other warnings. One is the unusually heavy downside volume over the last month. Another is the fact that the 14-month RSI is turning down from major overbought territory over 70 (down arrow). The financial sector is undergoing a major test of its long-term uptrend. That's a big test for the rest of the market as well.