Hello Fellow Chartwatchers!
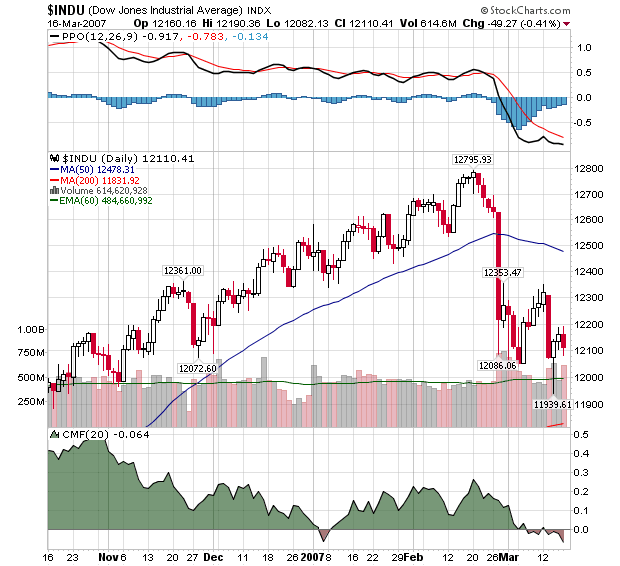
Last week's recovery rally was crushed by Tuesday's big decline and while the Dow quickly rose back above 12,000, the technical damage was done. The chart below shows the important technical developments for the Dow in recent days. See if you can spot the key signals.

For me, the key signals include:
-
The PPO is at its lowest level in months.
-
The CMF remains in negative territory and appears headed lower.
-
The 200-day Moving Average has reappeared on the chart (the thin red line on the lower right corner of the price plot area).
-
Volume has been significantly higher since the big drop at the end of February.
-
Support at 12,000 remains strong (so far) - but that's about the only bullish technical signal right now.

About the author:
Chip Anderson is the founder and president of StockCharts.com.
He founded the company after working as a Windows developer and corporate consultant at Microsoft from 1987 to 1997.
Since 1999, Chip has guided the growth and development of StockCharts.com into a trusted financial enterprise and highly-valued resource in the industry.
In this blog, Chip shares his tips and tricks on how to maximize the tools and resources available at StockCharts.com, and provides updates about new features or additions to the site.
Learn More