I discussed many months ago how the rotation from the tech-heavy NASDAQ to the safety of the Dow Jones evolves over time. As earnings disappoint and growth slows, money moves away from the high octane growth stocks to the more conservative components of the Dow. That's what we saw back from 1984 through 1991 and again from 2000 to 2002. But when our economy grows and earnings begin to expand, money flows in the opposite direction - away from the Dow and into the NASDAQ. I believe we remain in this latter environment. Our economy is expected to grow in the second half of 2007 and into 2008 and if inflation remains in check, and I believe it will, this environment sets up beautifully for the higher growth NASDAQ stocks.
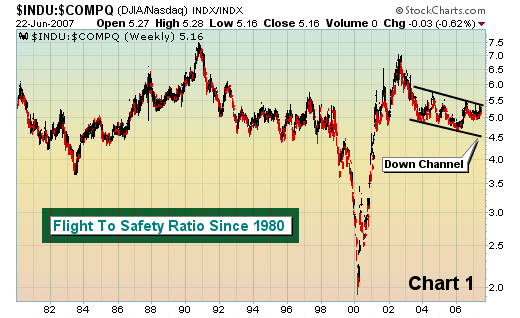
In Chart 1, I have reposted a chart from last October's newsletter showing the relationship between the Dow Jones and the NASDAQ since 1980. This "Flight To Safety Ratio" (calculated by dividing the Dow Jones Industrial Average by the NASDAQ) moves higher as money searches for the "safe haven" and moves lower as the NASDAQ leads during higher growth periods. You can see the down channel that has developed since 2003. Over the next 2-3 years, I'm expecting a continued move lower in this Flight To Safety Ratio to a point somewhere in the 4.00-4.25 range, marking a long-term bottom.
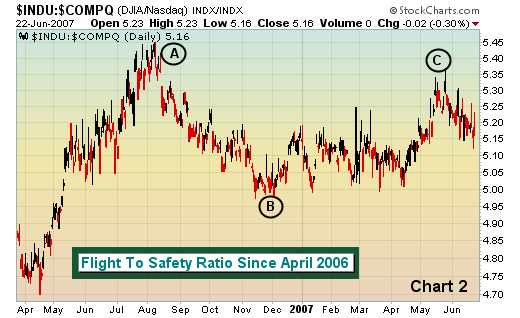
Chart 2 below shows a clear view of how the money rotates when the market fears that future earnings growth is in jeopardy. Recall last May through July as oil and other commodity prices surged and fears raged that higher commodity prices would mean higher inflation. The high growth NASDAQ plummeted much faster than the Dow Jones and S&P 500, resulting in a very quick spike in the Flight To Safety Ratio (Point A). Those fears were never realized however and market participants quickly moved money back to the higher growth equities on the NASDAQ by the end of 2006 (Point B). Then just recently, the increasing yield on the 10 year treasury note heightened levels of fear about future economic growth and again the money flowed out of growth and toward the safer Dow components (Point C). I believe our economy will strengthen during the balance of 2007 and into 2008 and we'll see this ratio continuing down in the channel that was illustrat ed in Chart 1.
There remains a lot of pessimism in the market as evidenced by very high historical put call ratio readings and a spiking VIX (volatility index). These two factors historically promote continued bullishness and do not coincide with long-term tops. If equity prices continue higher and economic growth keys the rally, you have to favor the higher PE stocks found on the NASDAQ.