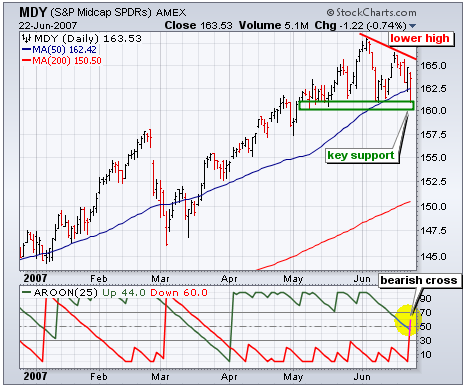
The S&P Midcap ETF (MDY) remains in an uptrend for now, but a lower high and waning upside momentum are cause for concern. The ETF established support around 160-161 with reaction lows in May and June. In addition, the rising 50-day moving average marks support in this area. The ETF formed a lower high six days ago and a break below key support at 160 would forge a lower low. This would be medium-term bearish and call for a retracement of the March-June advance.
According to the Aroon indicators, the upside is loosing momentum and the downside is gaining momentum. The uptrend was strong as long as Aroon Up (green) held above 70, which was from 3-Apr to 14-Jun. Aroon Up moved below 50 for the first time since 2-April and upside momentum is waning. In contrast, Aroon Down (red) moved above 50 for the first time since late March and downside momentum is increasing. Look for a move above 70 in Aroon red to signal an acceleration of downside momentum and confirm a support break at 160.