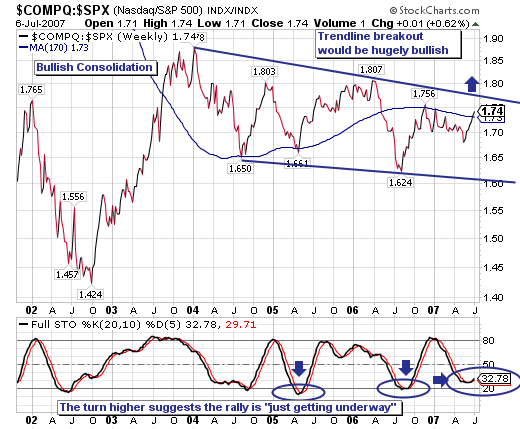
In November-2006, we noted that if one previewed the NASDAQ Composite/S&P 500 Ratio, one would find a very well pronounced and bullish consolidation forming. Well, its been 3 ½ years and the consolidation is still forming; however, there are emerging technical signs that a major breakout is forthcoming – one that would see technology stocks move to the forefront of market leadership in a manner not seen since the October-2002 to January-2004 relative rally that took the ratio from 1.42 to 1.88. Moreover, the rally could well become explosive to the upside.
First, we would call attention to the nascent breakout above the 170-week moving average; in the past this has provided a fulcrum point for trend reversals. And perhaps this is the case at present given the breakout above this level is not yet sufficient to warrant an "all clear" siren; but – the 20-week stochastic is just now turning higher from oversold levels consistent with past rallies of at least 0.14. If this circumstance were to occur this time, then we would see the ratio breakout above the bullish consolidation's trendline resistance level and above the April-2006 level of 1.81... putting the ratio at its highest level since late-2003 or early-2004.
Finally, on further confirmation of this nascent breakout, our upside target guide using the October-2002 rally into January-2004 rally would be around 2.07, with the time within 12-18 months. .Thus, it would seem wise to trade this "pairs trade" using a long QQQQ/short SPY position. Or, if one believes the markets is headed higher from current levels or if one must be long for any stylistic reason – then perhaps selected outright long positions in technology are warranted. In any case... the unloved technology sector is poised to gain substantial sponsorship.