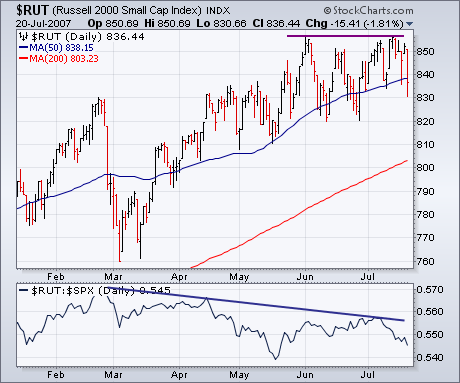
I suggested Friday that part of the recent weakness in market breadth figures was most likely due to the fact that most of the recent buying has been in large cap stocks, and that small cap indexes had yet to hit new highs. That discrepancy is shown in the chart below. The Russell 2000 Small Cap Index has been unable to clear its early June peak. [The same is true of the S&P 600 Small Cap and the S&P 400 MidCap Indexes]. The relative weakness in small caps is even evident in today's market selling. Small caps fell much harder than large caps. Below, the RUT is in danger of breaking its 50-day average. The RUT/S&P ratio at the bottom of the chart shows small caps lagging behind large caps throughout the latest market upleg. That's where a lot of the breadth deterioration is coming from. A lot of the breadth weakness is also coming from a continuing breakdown in financial shares. That's because the financial sector has the heaviest weighting in the S&P 500. Financials stocks have been lagging behind the rising market for months and are today's weakest sector. So is anything tied to housing.