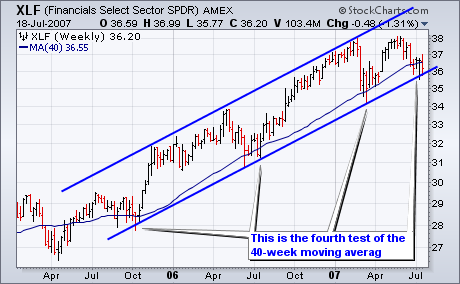
Despite a sharp decline over the last six weeks, the Finance SPDR (XLF) remains in a long-term uptrend on the weekly chart and support is at hand. The Finance SPDR (XLF) met resistance at 38 twice this year and declined to around 36-36.5 in June and July. The lower trendline of a rising price channel and the 40-week moving average mark support here. The 40-week moving average is equivalent to the 200-day moving average (40 x 5 = 200) and the 40-week held in October 2005, July 2006 and March 2007. This key moving average is getting a big test once again and a move below the July low would solidify a break. This would also break the lower trendline of the rising price channel and the long-term implications would be bearish.
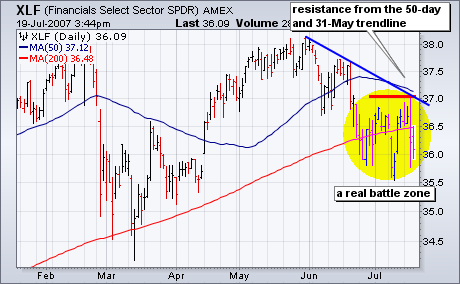
As long as XLF trades near long-term support, the decline on the daily chart could be a mere correction and a trend reversal would be quite bullish. The 31-May trendline, 50-day moving average and July highs established resistance at 37. XLF needs to break above this level to reverse the downtrend on the daily chart and resume the uptrend on the weekly chart. However, the medium-term trend is down as long as resistance at 37 holds and traders should be on guard for a break below the July low.