ChartWatchers August 25, 2007 at 10:06 PM
We've discussed in the past the tendency of the market to put in long-term bottoms when the bearish sentiment reaches extreme levels. Extreme bearishness is exactly what we saw on Thursday, August 16... Read More
ChartWatchers August 25, 2007 at 10:04 PM
In my August 17 article, Looking For A Retest, I speculated that we would get a bounce from the extreme price lows hit in mid-August, but that a retest of those lows needed to occur before we could be reasonably certain that the completion of a solid bottom had been accomplished... Read More
ChartWatchers August 25, 2007 at 10:03 PM
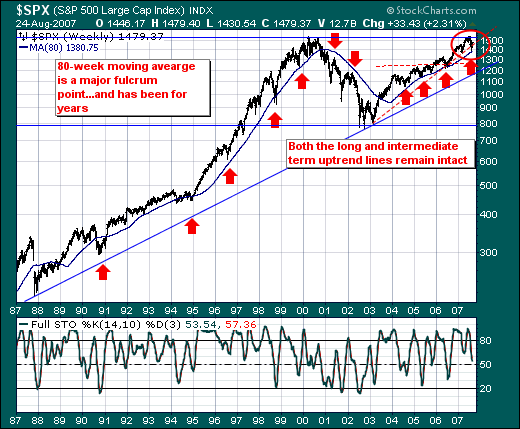
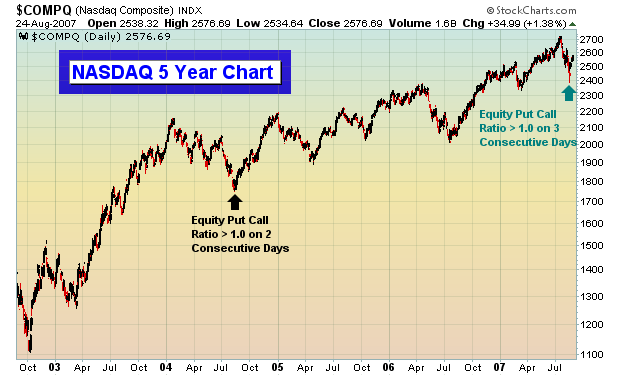
Given the volatility of the capital markets these past two weeks, we think it instructive to step back and take a longer-term viewpoint of the stock market to discern where we may be in the cycle... Read More
ChartWatchers August 25, 2007 at 10:02 PM
We are continuing to make progress in our efforts to get a second data feed into our offices. A second data feed should help us avoid the kind of problems we had several weeks back... Read More
ChartWatchers August 25, 2007 at 10:01 PM
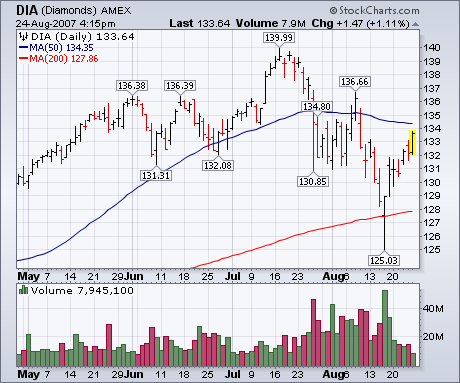
Friday's higher prices continued the market rally that started the previous Thursday. The three charts below show major market ETFs all back above their 200-day moving averages, which removes any immediate threat of a bear market... Read More
ChartWatchers August 25, 2007 at 10:00 PM
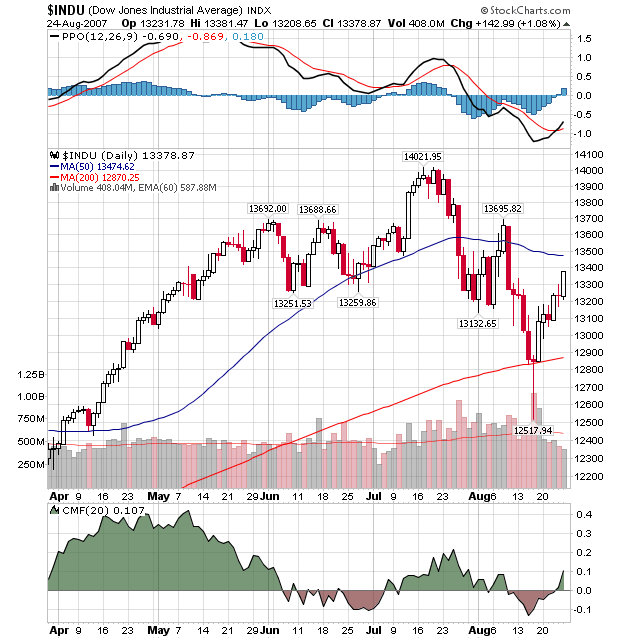
Last week, some significant positive technical developments occurred on our GalleryView chart of the Dow: After recovering to remain above the 200-day moving the previous week (see the red candle whose shadow dipped all the way to 12,517?), the Dow has rebounded nicely with a nic... Read More
ChartWatchers August 04, 2007 at 10:05 PM
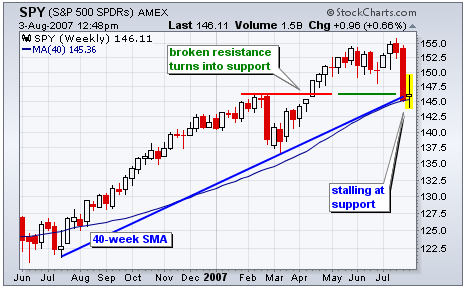
The S&P 500 ETF (SPY) firmed this week and found some support. The ETF hit support from the 40-week moving average and broken resistance. The 40-week moving average is equivalent to the 200-day moving average and this level is important to the long-term trend... Read More
ChartWatchers August 04, 2007 at 10:04 PM
A month ago I wrote an article stating that I thought that the 20-Week Cycle was cresting and that we should expect a decline into the cycle trough that would probably break down through the support provided by the bottom of the trading channel, setting up a bear trap... Read More
ChartWatchers August 04, 2007 at 10:03 PM
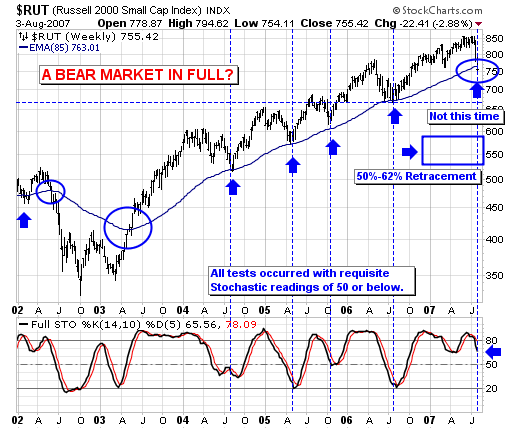
Last week was a treacherous week indeed, with stock prices falling universally. That said, one of the "weakest indices" was related to the US small cap arena, and specifically to the Russell 2000 Index ($RUT)... Read More
ChartWatchers August 04, 2007 at 10:01 PM
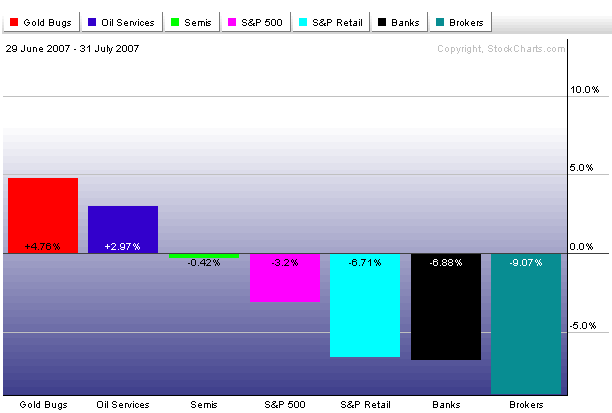
The chart above shows "John's Latest Performance Chart" that reflects the market's stronger and weaker groups during the hightly volatile month of July. All are plotted around the S&P 500 which lost 3.2% during July. [The S&P can also be plotted as a zero line]... Read More
ChartWatchers August 04, 2007 at 10:00 PM

The troops are mustered. The swords are out. The orders have been posted. The pieces are in place. The die has been cast. (The metaphors are getting lame. ) However you want to say it, the battle line for the Bulls and the Bears has been drawn... Read More