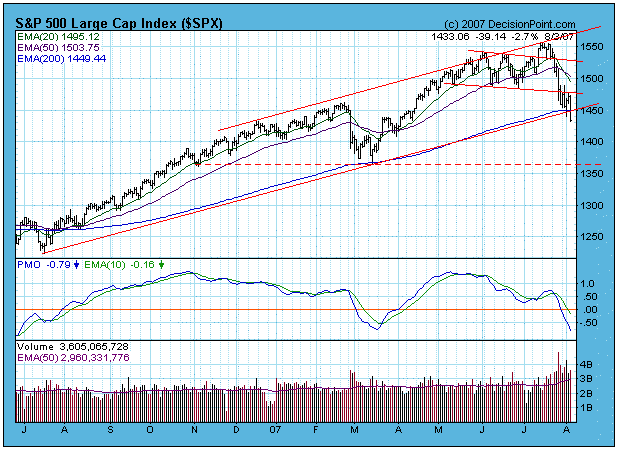
A month ago I wrote an article stating that I thought that the 20-Week Cycle was cresting and that we should expect a decline into the cycle trough that would probably break down through the support provided by the bottom of the trading channel, setting up a bear trap. So far so good. As you can see on the chart below, the S&P 500 has broken down through the horizontal channel support, as well as an important rising trend line. The trend line break is not decisive (at least 3%), but this break down has gone farther than I had expected.
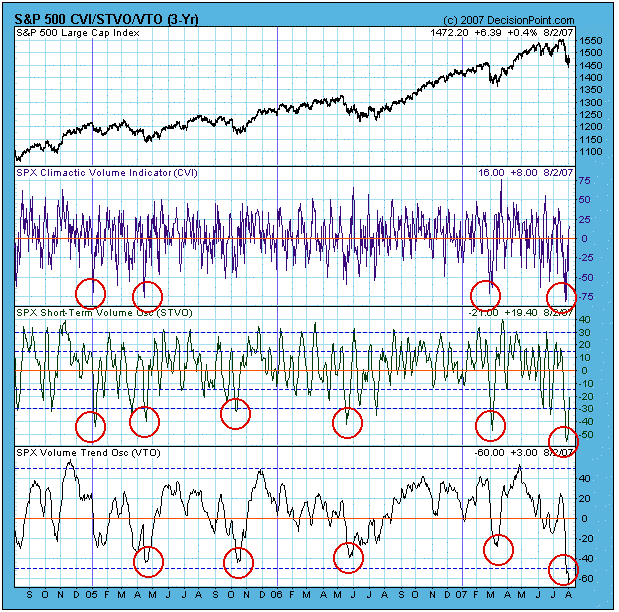
In the process of the recent decline the market has become very oversold, as demonstrated by the next two charts. The first is our OBV suite, which includes the CVI (Climactic Volume Indicator), STVO (ST Volume Oscillator), and VTO (Volume Trend Oscillator). All three of these indicators have hit very oversold levels, levels from which rallies normally emerge.
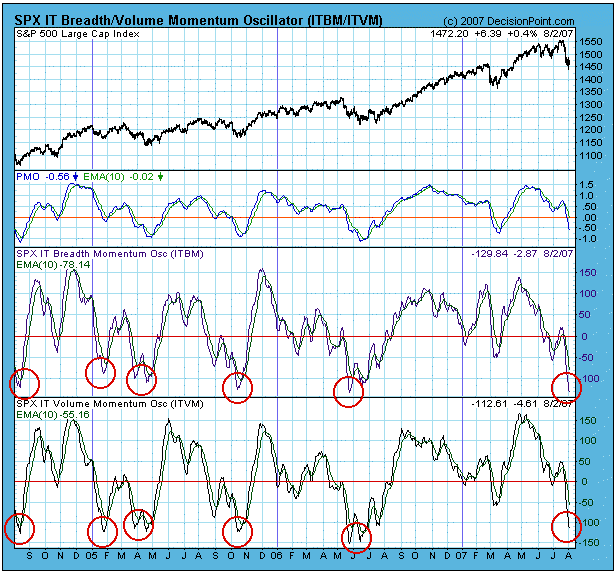
The same is true for the ITBM (IT Breadth Momentum) and ITVM (IT Volume Momentum) Oscillators, which reflect a substantial internal correction, and tell us that we should start looking for a bottom.
As usual I would caution against trying to pick a bottom. For one thing, our primary timing model switched to neutral on July 31, which I think is a good place to be while the market is still displaying weakness. Another thing to consider is that the bears could be right about new bear market just beginning. If this is the case, oversold readings are extremely dangerous and can actually signal the likelihood of even more severe declines. To reiterate, oversold in a bull market means a bottom is near, but in a bear market it means "look out below!"
Bottom Line: The market has become very oversold, and I expect to see a bottom forming over the next several weeks. I am still overall optimistic because of the 20-Week Cycle alignment with the current decline, and because we are still in the beginning of the 4-Year Cycle; however, caution is recommended until our timing model switches back to a buy signal.


