Two weeks ago I stated that market strength was mixed, and that I thought that the correction had several more weeks to go before it was over. Since then further breakdowns of support have occurred, most notably on the Nasdaq 100 Index chart, which experienced a major break of its rising trend line, eliminating the one area of strength that supported a "mixed" assessment for the overall market.
Currently, a correction is in progress that is affecting all major indexes, and my opinion is that it is likely to continue into mid-December. One of the reasons I believe this is that, while the market is approaching oversold levels, it is not as oversold as it needs to be, and more technical work is needed before we can have confidence that a solid bottom has been made.
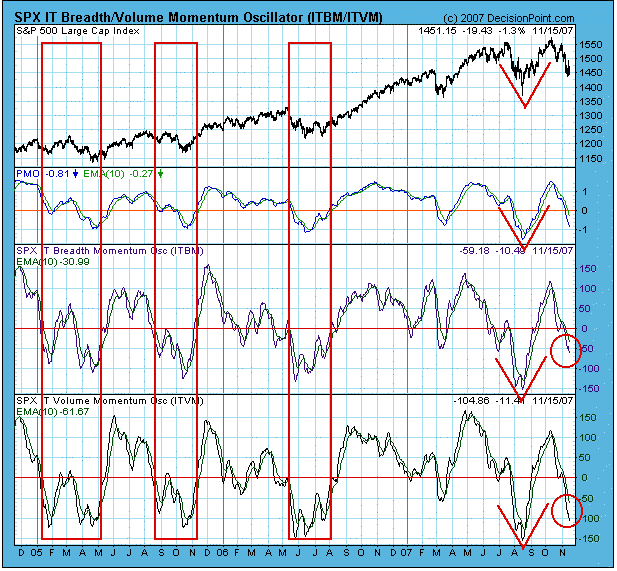
On the first chart below we can see that the three primary indicators of price, breadth, and volume are well below the zero line, but they have not yet hit the bottom of their normal ranges. Even after they hit bottom, a lot of work is needed to put in a solid bottom. I have put a box around previous bottoming actions. Note how several weeks and more than one indicator bottom is normally required to get the work done.
Also note how the August bottom differs from the others. It is what we call a "V" bottom, and there was no retest to make the bottom more solid. From a technical viewpoint, I believe that is why the rally ultimately failed.
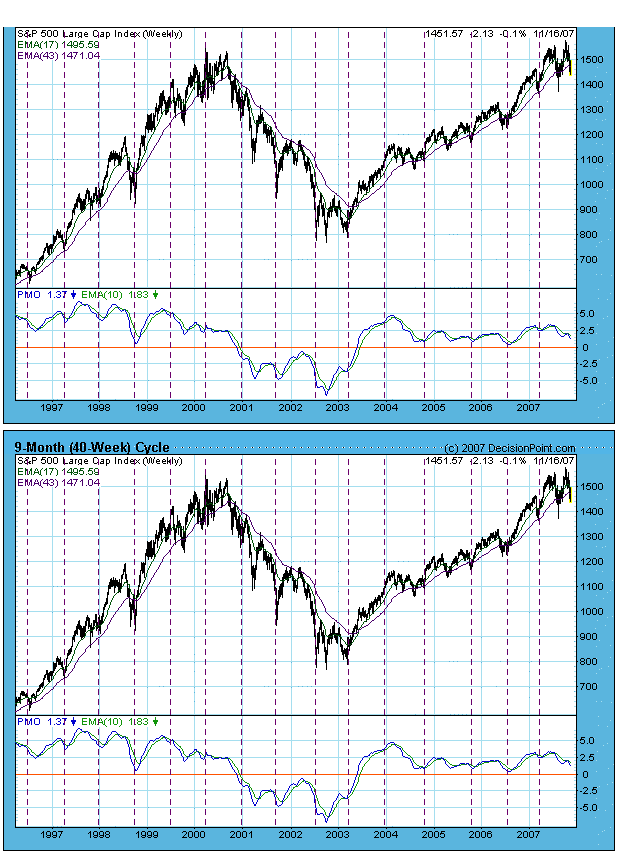
Another reason for my assessment is that the 9-Month Cycle is projected to make a trough around mid-December. As you can see by the cycle chart below, cycle projections are somewhat subjective, and cycle lows don't always appear where we think they should, but current market action and technical factors as described above make me believe we have a good chance of being right about the current cycle projection.
Bottom Line: While the market is becoming oversold, I believe that it will take several weeks before the decline is over and a solid bottom is in place. This belief is supported by what we can observe as historical norms for corrections, and by our 9-Month Cycle projection. Any rally that emerges before the proper amount of work is done is likely to fail.


