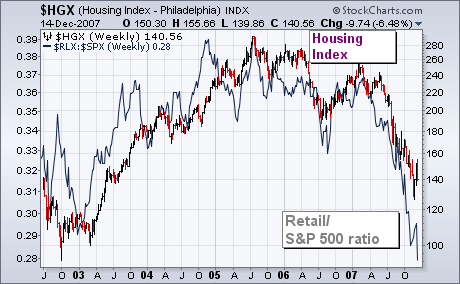
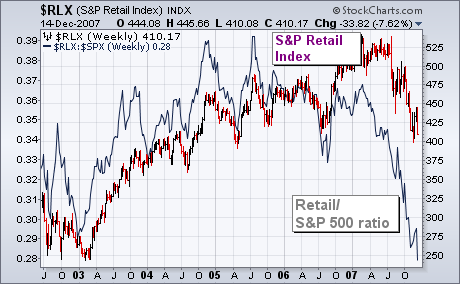
The two charts below demonstrate part of the reason why recent Fed moves haven't had much of a positive impact on the stock market. It has to do with negative fallout on retail spending resulting from the housing meltdown. The bars in Chart 1 plot the S&P 500 Retail Index, which has been one of the year's weakest groups. The RLX is on the verge of falling to a new three-year low. Its relative strength ratio (solid line) has already reached a five-year low. If the weak performance of retail stocks is a leading indicator of retail spending (which I believe it is), and if retail spending is 70% of the U.S. economy, then Chart 2 carries bad news for the U.S. economy and stock market. What's causing the retail breakdown? Chart 2 overlays the same Retail/S&P 500 ratio over a bar chart of the PHLX Housing Index. Notice the close correlation between the two lines. They both peaked in the middle of 2005 and have been falling together since then. In other words, the housing depression is closely tied to the retail breakdown. That suggests that there's a lot more to worry about than just subprime mortgages and liquidity problems. Which may also explain why recent Fed moves aren't helping much.