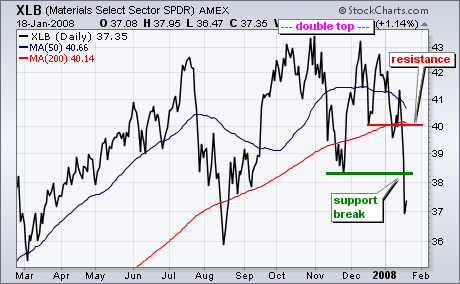
The Materials SPDR (XLB) joined the double top club with a sharp decline this past week. The Finance SPDR (XLF) and Consumer Discretionary SPDR (XLY) started the club with double top support breaks in August. The Russell 2000 ETF (IWM) broke double top support in November. And finally, the S&P 500 ETF (SPY) broke double top support this year. These are not small double tops, but rather large reversal patterns that have been confirmed. Moreover, these are important ETFs and lower lows are clearly bearish.
The double top unfolded as XLB met resistance around 43 in October and again in December. The intermittent low formed in November and XLB broke below this low to confirm the pattern. XLB is also trading below its 50-day and 200-day moving averages. Even though the big trend is now down, the ETF is short-term oversold and could bounce. Broken support turns into resistance around 40 and there is also resistance in this area from the two key moving averages. An oversold bounce is possible, but I would expect it to fail around 40. Look back at the XLF and XLY double tops for clues on how this pattern may unfold in the coming weeks and months.