ChartWatchers February 16, 2008 at 11:06 PM
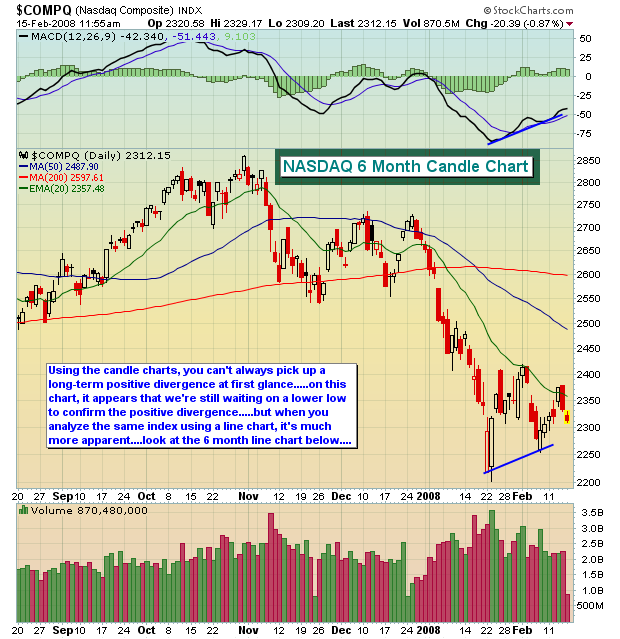
This is a rarity. I am proposing that you use line charts - in one instance. A line chart simply connects one closing price to the next closing price. Intraday activity does not appear and is ignored... Read More
ChartWatchers February 16, 2008 at 11:05 PM
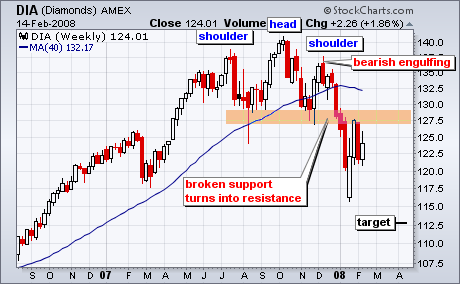
In the 15-December issue of ChartWatchers, I pointed out the possibility of a head-and-shoulders top in the Dow Industrials ETF (DIA). The ETF formed a weekly bearish engulfing pattern that week and this marked the mid December high... Read More
ChartWatchers February 16, 2008 at 11:04 PM
When the market began to rally this week, it looked as if a successful retest of last month's lows had occurred and that another up leg had begun; however, what looked like the start of a new rising trend, has now morphed into a triangle formation with the price index trying to b... Read More
ChartWatchers February 16, 2008 at 11:02 PM
Dow Jones announced last week that they are removing Altria and Honeywell from the index and adding Citibank and Chevron. The change takes effect at the start of trading on Tuesday... Read More
ChartWatchers February 16, 2008 at 11:01 PM
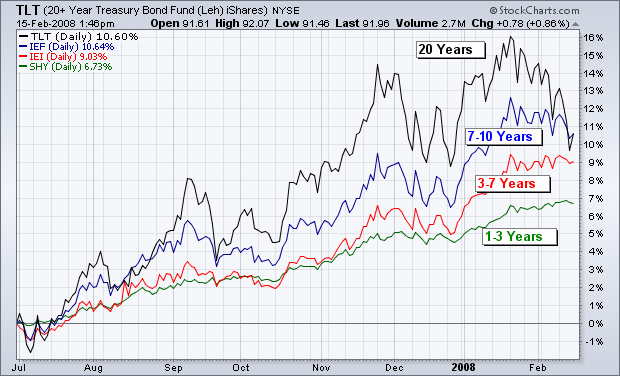
The below chart compares the performance of four T-bond ETFs since last July, when money started to flow out of stocks and into bonds. The four ETFs represent different durations in the yield curve... Read More
ChartWatchers February 16, 2008 at 11:00 PM
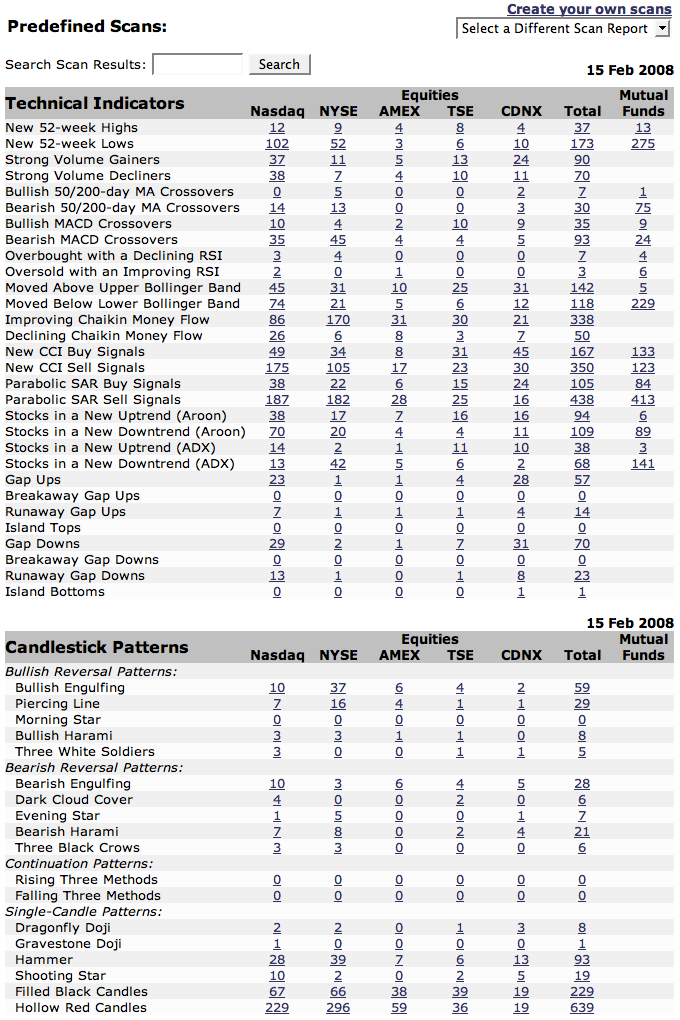
StockCharts.com has an extensive collection of Market Breadth indicators. Many of them can be found under the "Breadth Charts" link on the left side of our homepage... Read More
ChartWatchers February 03, 2008 at 11:06 PM
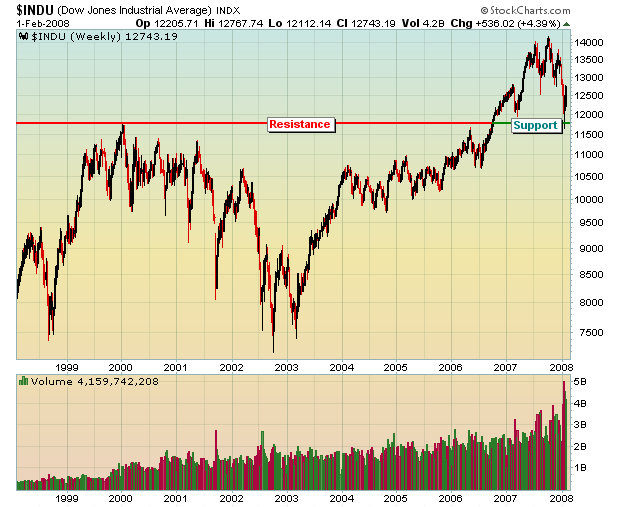
want to recap what was discussed in the last ChartWatchers newsletter. We were approaching significant long-term price support on the Dow and the lower trendline on the NASDAQ while pessimism was starting to ramp up... Read More
ChartWatchers February 03, 2008 at 11:05 PM
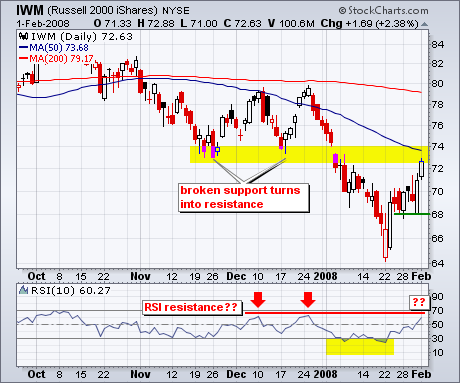
With an oversold bounce over the last two weeks, the Russell 2000 ETF (IWM) is nearing a resistance zone from broken support and the 50-day moving average. Before going further, I should emphasize that the overall trend remains down for two reasons... Read More
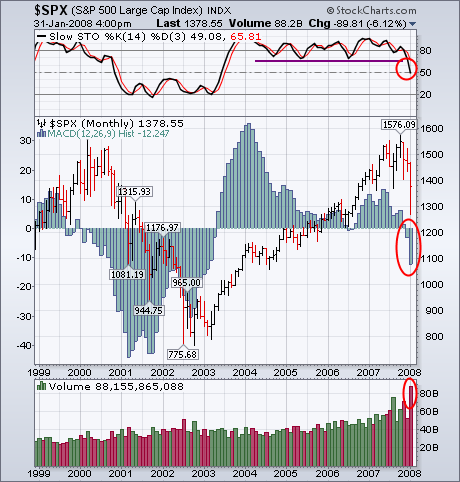
ChartWatchers February 03, 2008 at 11:04 PM
In my January 18 article I asserted that we had entered a bear market based upon long-term sell signals generated by downside moving average crossovers on the daily and weekly charts of the S&P 500... Read More
ChartWatchers February 03, 2008 at 11:03 PM
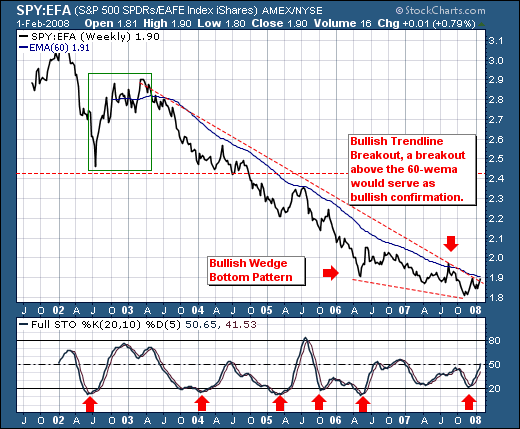
We recently noted the US had in our opinion entered into a bear market; hence we believe rallies are to be sold in the coming weeks/months as prices enter into resistance... Read More
ChartWatchers February 03, 2008 at 11:02 PM
We hit two milestones with our Datafeed Upgrade project during the past week. First, the upgraded data connections for our older Thomson feed were installed on Friday... Read More
ChartWatchers February 03, 2008 at 11:01 PM
I haven't heard anyone in the media talking about the January Barometer, which is based on the view that "as January goes, so goes the year". That's probably because they only talk about it when the market has a strong January, which predicts a good year... Read More
ChartWatchers February 03, 2008 at 11:00 PM
Hello Fellow ChartWatchers! First off I just want to take a second and say "Welcome" to all of our new members. Since January 1st, almost 1,000 new members have joined StockCharts.com(!)... Read More