Hello Fellow ChartWatchers!
Sorry for the ghastly title to this article, but the charts are rather ghastly as the moment and - as the image below shows - the damage is widespread:
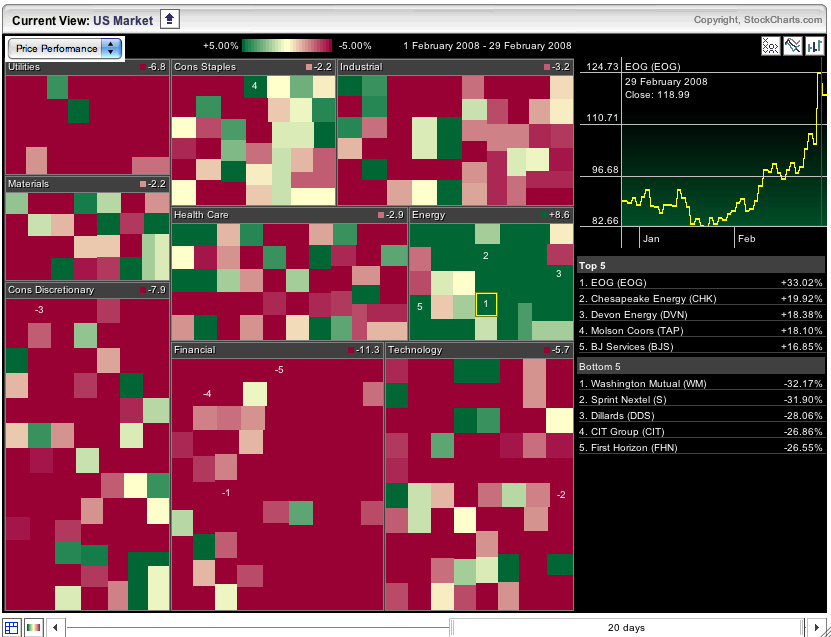
That is a snapshot of our S&P Sector Market Carpet right now. Each stock in the carpet is represented by a colored square. The color of the square is determined by the change in the stock's price since February 1st. Dark red indicates a greater than 5% loss; dark green indicates a greater than 5% gain.
As you can see, there's only one sector that survived February - the Energy stocks. Our PerfChart tool brings that fact into even sharper focus:
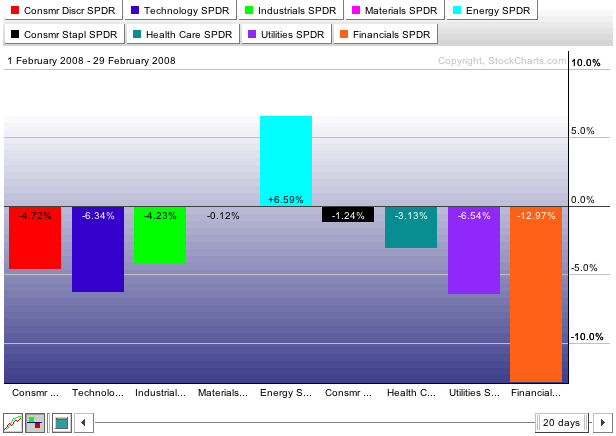
Keep these two great tools in mind as you follow the upcoming twists and turns in the markets. They should keep you out of trouble.
