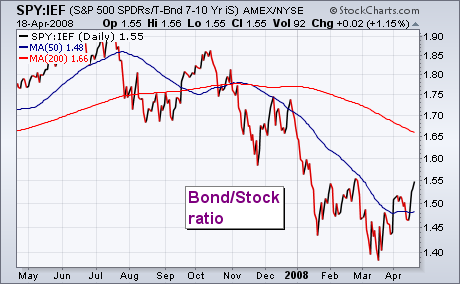
This week's market action has been characterized by stock buying and bond selling. The change in the relationship between those two markets is shown in the chart below which plots a ratio of the 7-10 Year Treasury Bond Fund (IEF) by the S&P 500 SPDRS (SPY). The falling ratio since October shows that investors have favored bond prices over the last six months. Since mid-March, however, the ratio has turned up. That means that investors are rotating out of bonds and back to stocks. The rise in the ratio isn't enough to signal a major trend change between the two asset classes. But it does show that investors are feeling a bit more optimistic. Rising bond yields gave a boost to the dollar today and caused heavy profit-taking in gold.

About the author:
Chip Anderson is the founder and president of StockCharts.com.
He founded the company after working as a Windows developer and corporate consultant at Microsoft from 1987 to 1997.
Since 1999, Chip has guided the growth and development of StockCharts.com into a trusted financial enterprise and highly-valued resource in the industry.
In this blog, Chip shares his tips and tricks on how to maximize the tools and resources available at StockCharts.com, and provides updates about new features or additions to the site.
Learn More