ChartWatchers May 17, 2008 at 10:05 PM
I've been bullish since my earlier bottom call in January. There were several reasons for the call, but in particular there were contrarian indicators moving off the charts in the bearish direction. That suggested that the next move in the market would be higher - and it was... Read More
ChartWatchers May 17, 2008 at 10:04 PM
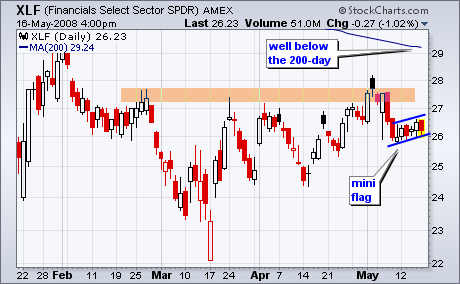
Money may be moving into Technology, but it is avoiding Finance and Healthcare. While the Dow Industrials ETF and S&P 500 ETF both touched their 200-day moving averages in May, the Finance SPDR (XLF) and the Healthcare SPDR (XLV) fell well short of their 200-day lines... Read More
ChartWatchers May 17, 2008 at 10:03 PM
Our long-term model remains on a sell signal, so we have to assume that we are still in a bear market; however, the rally from the March lows has taken prices far enough to cause important bullish signs to appear: (1) The intermediate-term model for the S&P 500 is on a buy signal... Read More
ChartWatchers May 17, 2008 at 10:01 PM
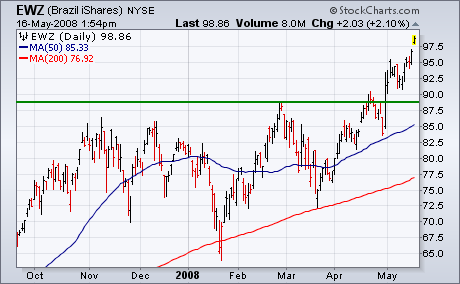
On Monday, I wrote about three foreign stock markets that were at or close to new record highs. Those three markets are Brazil, Canada, and Russia. What all three have in common was that they are producers and exporters of commodities... Read More
ChartWatchers May 17, 2008 at 10:00 PM
Last week, we started getting disturbing reports from several users about seeing the wrong name at the top of the page after they logged in to StockCharts.com. That set off HUGE RED WARNING LIGHTS here... Read More
ChartWatchers May 04, 2008 at 10:05 PM
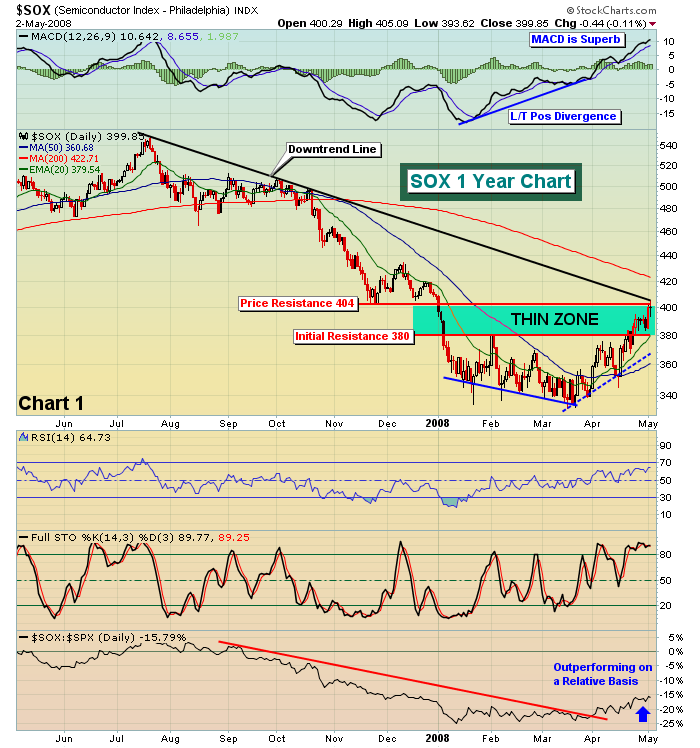
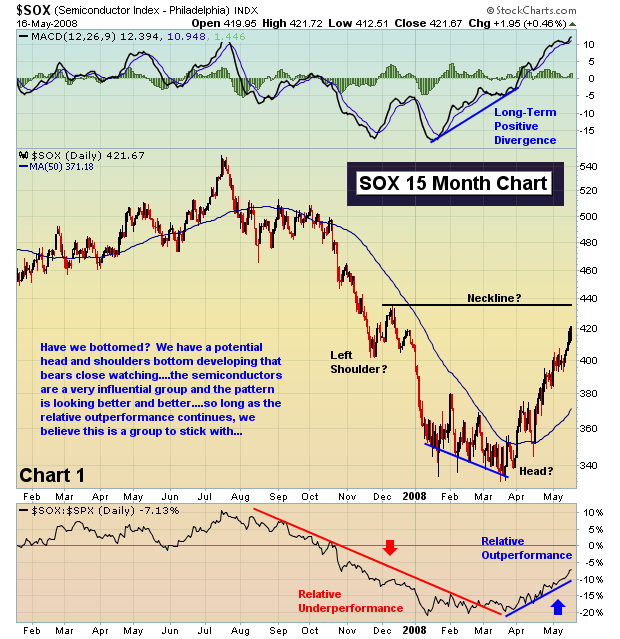
It's been a long time since we've spoken about semiconductors or financials in a positive light. But times have changed and so have the charts for these two influential groups... Read More
ChartWatchers May 04, 2008 at 10:04 PM
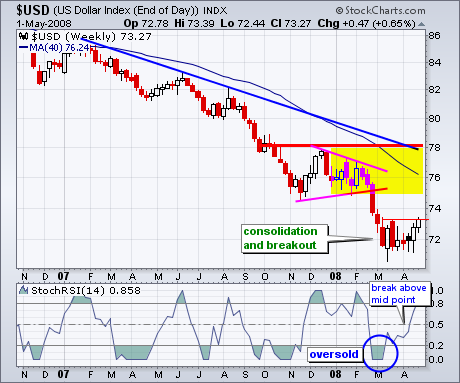
The U.S. Dollar Index ($USD) remains in a long-term downtrend, but the index is showing signs of strength with a consolidation breakout this week. After becoming oversold in March, the index firmed for 6-7 weeks and surged above its mid March highs this week... Read More
ChartWatchers May 04, 2008 at 10:03 PM
Something you will be hearing a lot about for a while is that for the next six months the market will be carrying extra drag caused by negative seasonality... Read More
ChartWatchers May 04, 2008 at 10:02 PM
It is rather clear there are ongoing "rolling corrections" beneath the surface in today's markets. In terms of performance, whether one is bullish or bearish on the broader market hasn't made as much of a difference as we would have thought... Read More
ChartWatchers May 04, 2008 at 10:01 PM
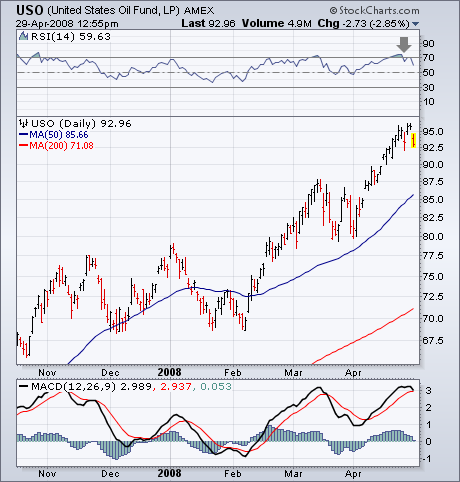
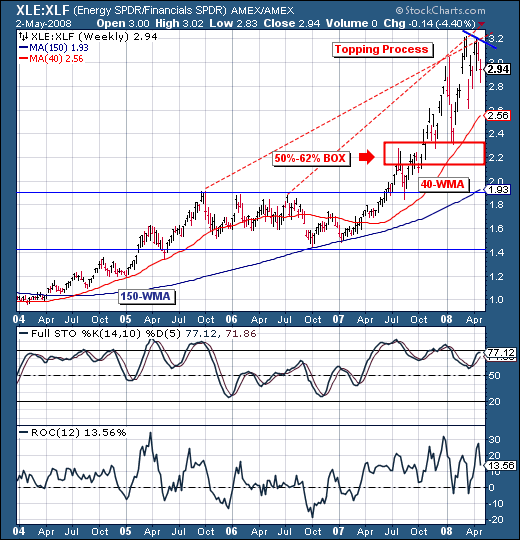
When only one commodity group is hitting new highs, that's usually a sign that it's out of step with the others. That seems to be the case with energy. I still believe that the energy complex is due for some profit-taking... Read More
ChartWatchers May 04, 2008 at 10:00 PM
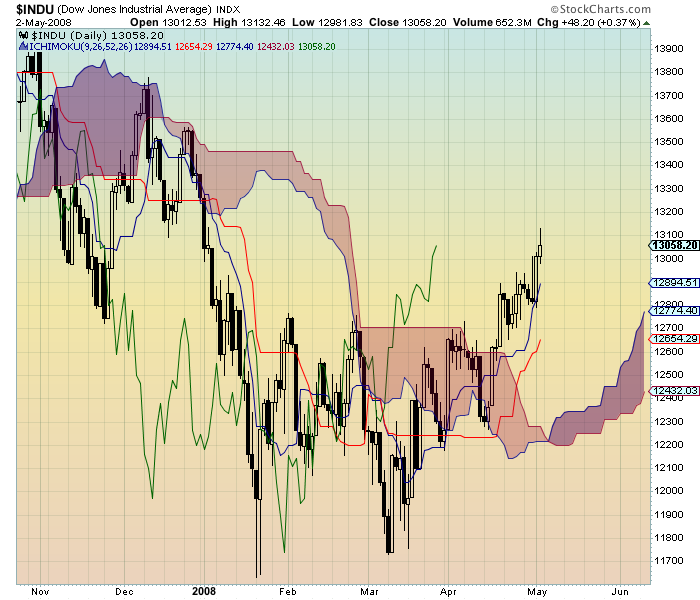
Clouds are gathering on your charting radar - can you see them? No, no - I'm not talking about the recent bad news on the US economy or the price of oil or any of that stuff. I'm talking about another new kind of chart that StockCharts... Read More