Clouds are gathering on your charting radar - can you see them? No, no - I'm not talking about the recent bad news on the US economy or the price of oil or any of that stuff. I'm talking about another new kind of chart that StockCharts.com will soon be offering to all our users - Ichimoku Cloud Charts!
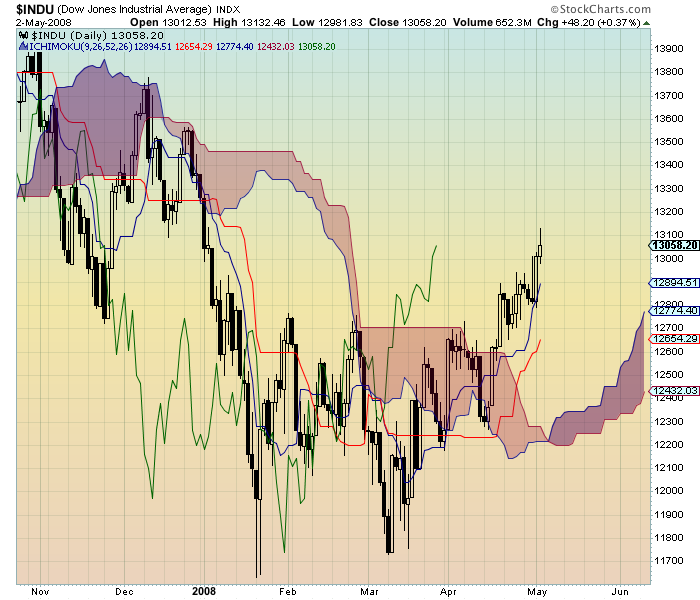
Ichimoku charts are similar to traditional candlestick charts but with several additional lines added to them as well as the unique "cloud" area. Here's an example of what one looks like:
(Note: These are not available yet! We are putting the finishing touches on them this week. Watch for an announcement in the "What's New" section of the site later this week.)
In the example chart above, the shaded area is called the "the Cloud". It serves as a dynamic support/resistance zone that prices tend to bounce off of. The thickness of the cloud is an indication of its "strength" - prices are more likely to break through thin cloud areas, than thick ones. The Cloud also can "trap" prices for a period of time - for instance from mid-March to mid-April. Finally, the thick green line that ends in late March is called the "Chikou Line" ("Lagging Line") and right now it is looking bullish since there is nothing above it (no clouds, no candlesticks, etc.).
There are lots of other aspects to interpreting Ichimoku charts which I can't get into in this article. Look for our ChartSchool to include a detailed article on the topic soon. Until then here are two resources you may want to look into to:
Here is a link to a nice article on FXWords.com about Ichimoku charts. And here is a link to a great book on the topic which we sell in our online bookstore.
Again, we hope to have live Ichimoku charts on our website in the next week or so. Stay tuned...
