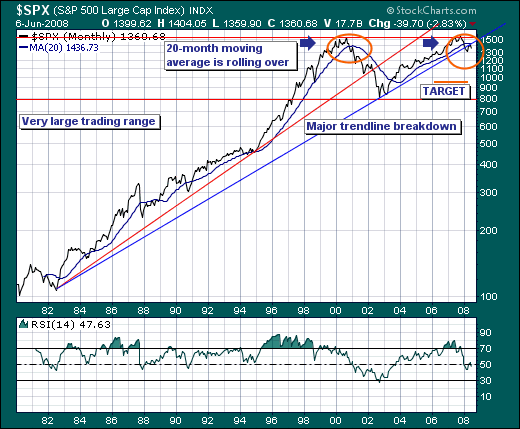
When markets become as volatile as they have in the past week; it is best to stand back and take a look at the longer-term time horizon. We like to use the S&P 500 as our proxy; and as week look at the monthly chart - we find the S&P having broken down through several critical long-term support levels. This suggests the probability has increased substantially that a bear market has indeed begun - with further significant damage to be wrought in the months ahead.
Quite simply, the 1980-2002 bull market trendline was violated; the importance of which can't be underestimated. The last time a trendline of this magnitude was violated, the S&P fell roughly -27% from the breakdown level. If that were to occur once again - then it would argue for a lower target of 985 from its current 1360 level. This has significant implications towards tactical trading to be sure. Moreover, confirming this major breakdown, the 20-month moving average was violated and is now turning lower - a circumstance last seen at the end of 2001. We all know the subsequent damage done thereafter.
Therefore, taking the long-term perspective and perhaps positing that last Thursday's rally was in essence the end of the countertrend rally off the March lows, while Friday's plunge the beginning of the next leg lower - one should certainly consider becoming more defensive and/or putting on short positions.