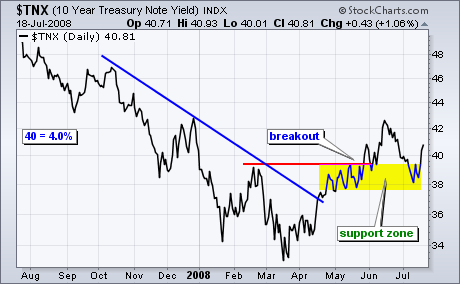
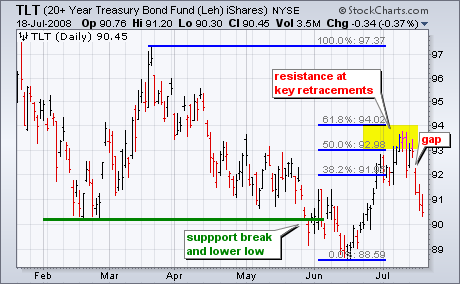
After the Producer Price Index (PPI) surged on Tuesday, it was little surprise to see big gains in the Consumer Price Index (CPI) on Wednesday. Bernanke warned of inflation in his congressional testimony last week and the PPI-CPI figures confirm. The CPI surged 5% year-on-year and 1.1% month-on-month. That 1.1% monthly gain translates into an annual rate much higher than 5%. The 5% year-on-year change was the highest since 1991, while the 1.1% month-on-month change was the highest since 1982. For the sake of argument, let's take the 5% year-on-year change as the annual inflation rate. The 10-Year Note Yield ($TNX) is currently around 4.08%, which means the real yield is actually negative (4.08% less 5% equals -.92%). A negative real yield is bad news for bonds. The first chart below shows the 10-Year Note Yield ($TNX) breaking resistance from its February highs with a surge above 4% (40). TNX pulled back over the last few weeks, but found support around 3.8% (38) and moved higher this week. The second chart shows the iShares 20+ Year Bond ETF (TLT) hitting resistance after retracing 50-62% of the March-June decline. The ETF gapped down on Wednesday as investors reacted to the news on inflation and the negative real yield.
There is also a videoversion of the this analysis available at TDTrader.com - Click Here.
