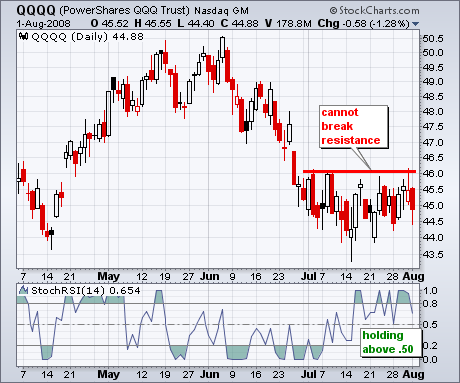
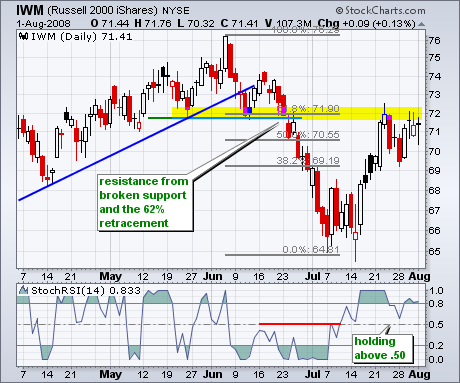
The Russell 2000 ETF (IWM) and Nasdaq 100 ETF (QQQQ) were stifled at resistance this week and the bulls are getting a test. After surging above 69, IWM met resistance at broken support and the 62% retracement mark. QQQQ met resistance at 46 in early July and this level held throughout the month. QQQQ shows relative weakness because the July breakout attempts failed. Both ETFs need to break resistance if the broad market rally is to continue.
Short-term momentum remains bullish for now. StochRSI is a nifty indicator that applies the Stochastic Oscillator to RSI. Yes, it is an indicator of an indicator. This makes it more sensitive than normal RSI and better suited for short-term signals. I like to think of it as RSI on Red Bull. On both ETF charts, StochRSI moved above .80 on 16-July and held above .50 since then. The surge above .80 turned short-term momentum bullish and the ability to hold above .50 kept the bulls in favor. For a counter signal that would turn short-term momentum bearish, I am watching for a sharp move below .20 in StochRSI.
There is also a videoversion of the this analysis available at TDTrader.com - Click Here.
