The world's temperature gauge for risk is what we refer to as the "carry-trade" indicator...or the Euro/Yen Spread. When this spread is rising, then the world is said to be putting the carry-trade on and expanding risk profiles; conversely, when the spread is falling...the carry-trade is being taken off and risk is being shunned. We look at this to take the temperature of the capital markets in terms of risk. Right now, the patient is sick, and risk is being shunned, and the technical prospects for the patient indicate further risk aversion and a continuation of the "de-leveraging process."
Our statement is backed up by the simple technical fact the weekly Euro/Yen Spread chart has broken below its bull market trendline as well as its bull market 120-week exponential moving average. This would imply the "triple top" will breakdown with a close under 1.52, which would then target previous high support at 1.40 and then even lower.
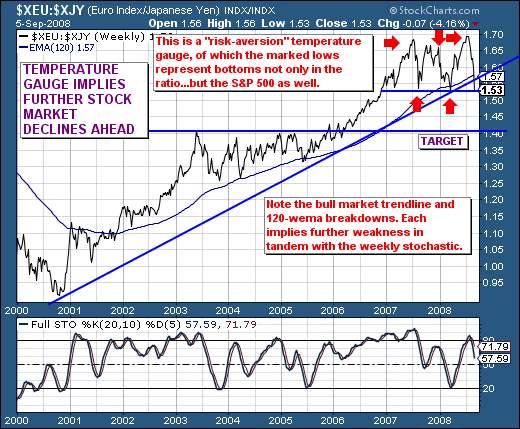
Therefore, the trend is lower, and we'll note the recent lows in the spread all coincided with trading lows in the S&P 500. Given this material breakdown in the spread, then we'll have to assume that further S&P 500 declines are ahead of us...perhaps sharply so. Henceforth, we are aggressive sellers of rallies as they materialize, with our downside S&P target still rather wide between 960 and 1090.
Good luck and good trading, Richard
