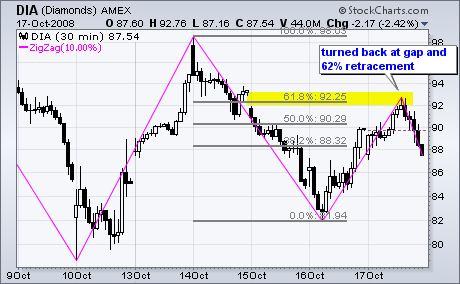
In a volatile week with huge swings, the Dow Industrials ETF (DIA) returned to Wednesday's gap with another 10% move. The magenta lines on the 30-minute chart show the zigzag indicator, which measures movements that are 10% or more. As you can see, there was an advance greater than 10% on 12-13 October, a decline greater than 10% on 14-16 October and an advance greater than 10% on 16-17 October. Wow, what a week for day traders. There was a day when these swings would look impressive on a weekly chart. Obviously, this is not your father's Dow.
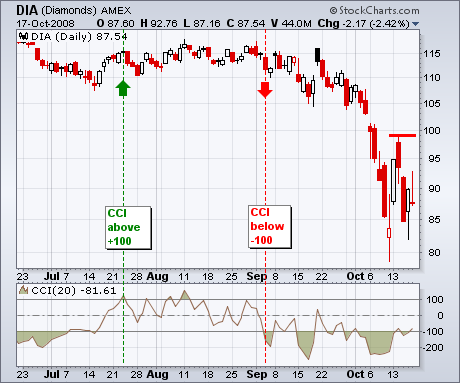
With these big swings, the Dow Industrials ETF (DIA) remains stuck in a volatile range and short of a breakout on the daily chart. I am watching two items to signal a trend changing breakout. First, the pullback on Tuesday-Wednesday established key resistance around 99. Mondays' surge was impressive and Thursday's recovery affirms support, but we have yet to see follow through and a resistance breakout. Second, the Commodity Channel Index (CCI) moved below -100 in early September and momentum remains bearish overall. At the very least, CCI needs to break into positive territory. However, I would like to see a surge above +100 to show some real strength and turn momentum bullish. Be sure to check out the corresponding video for more details.
There is also a video version of the this analysis available at TDTrader.com - Click Here.
