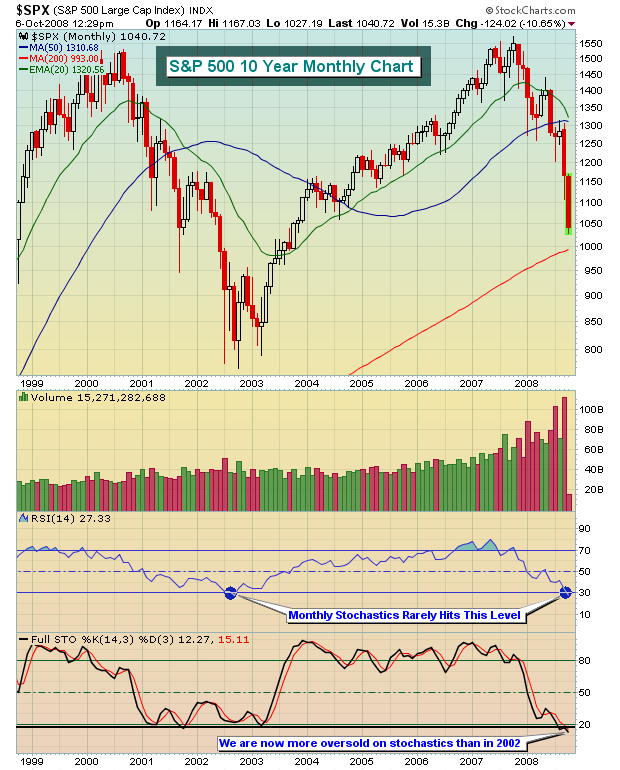
Two weeks ago, I said to buy the bottom. Sometimes, you're just wrong. I was wrong. Technical analysis is to the study of price action to increase the odds of predicting future price action. It's not an exact science, there are no guarantees, and there are times when you just have to tip your hat to the other side. So far, that's been the case. The market fell precipitously this past week, closing at new lows across our major indices. Volume was increasing late in the week, though it wasn't as heavy as we saw a couple weeks earlier. We can argue that it was the fault of Congress for acting too slowly. Others might argue that the bailout bill itself is the problem. From a technical perspective, the reason for the decline doesn't really matter. We're only concerned about what happened technically with the price action. We must always respect the combination of price/volume breakdowns, regardless of what other technicals are indicating. From the following monthly S&P 500 chart, you can see that we are as oversold now as we've been since the bottom of the bear market in 2002. Monthly RSI has moved below 30 and stochastics are approaching single digits, something that never happened in the 2000-2002 bear market.
We knew that September was historically weak and this past September certainly did nothing to disprove that notion. Since 1950 on the S&P 500, September is the only calendar month that has moved lower as opposed to moving higher. It is also the only calendar month that has negative annualized returns over the past 58 years. What many market participants don't realize is that Mondays are - by far - the worst day of the calendar week. Since 1950, the annualized return on Mondays (on the S&P 500) is a negative 16%. While I've done no study, I'd bet that psychological forces have a lot to do with it. But what's interesting is that if you had simply avoided trading on Mondays since the May 19th top (or shorted), your performance would likely have been much, much better. Consider the following: Since May 19th, we've had 17 Mondays, 12 of them the S&P 500 has moved lower. Of the 5 that have moved higher, only 1 (September 8) moved up more than 1%. Of the 12 down Mondays, 9 moved down more than 1% and 6 moved lower by 2% or more. Perhaps most astonishing is that the S&P 500 has lost 327.40 points since the close on May 19th, dropping from 1426.63 to 1099.23. The cumulative point losses on Mondays total 328.27, 100% of the decline. For comedy movie buffs who have seen Office Space, the stock market has had a REALLY "bad case of the Mondays".
