To say that the market is very oversold is not exactly breaking news because it has been oversold for at least a few weeks; however, the oversold condition has been steadily getting worse over that time, and we have perhaps reached the limit of how oversold the indicators will get without the market taking some time to clear the condition. Keep in mind that the condition can be cleared if the market merely drifts sideways while indicators drift higher toward neutral territory, but, considering the kind of volatility we have been experiencing, it seems that a rally is more likely.
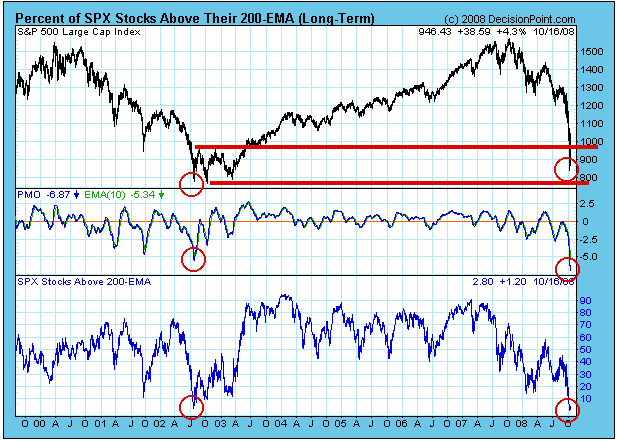
Let's look at the chart below, which has some major points of interest. First, the PMO (Price Momentum Oscillator) and the Percentage of Stocks Above Their 200-EMA have reached their lowest points since the July 2002, which was the beginning of the end of the 2000-2002 Bear Market. Note that it took nearly nine months for this bottoming process to take place in the form of a triple bottom. Also, current prices have dropped into the support zone provided by that previous bear market bottom.
This all looks like a pretty good setup for at least a bear market rally of some substance. The first thing that has to happen is a rally the lasts more than two days, and we need to see if the bottom will be a "V" spike or a double bottom with at least several weeks between each bottom. The latter would be preferable because, the more work put into the bottom, the longer the rally is likely to last. A "V" bottom would beg for a retest.
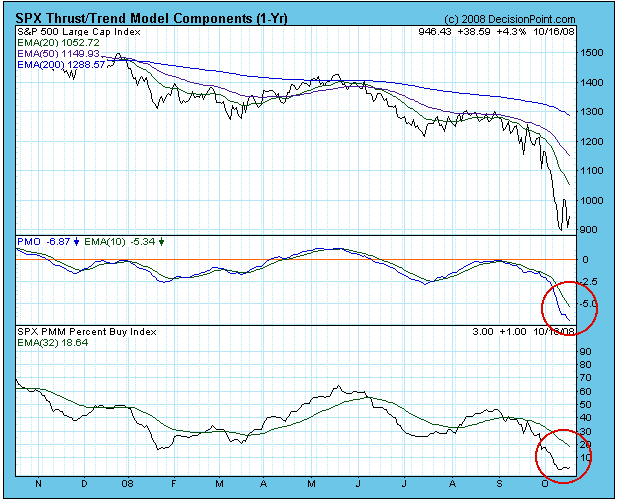
Any rally that begins now should be viewed and played as a short-term event, because we have seen how quickly they have been running out of steam. The first indication that a rally may develop into something longer term will be if the Thrust/Trend Model generates a buy signal. On the chart below I have highlighted the two components of the T/TM that we need to watch -- the PMO (Price Momentum Oscillator) and the Percent Buy Index (PBI). When both these indicators have passed up through their moving averages, a new buy signal will be generated. Even though this is a medium-term signal, it should also be worked as a short-term event, because of the whipsaw we have experienced during this bear market. (The rally last long enough to trigger a buy signal, then fails.)
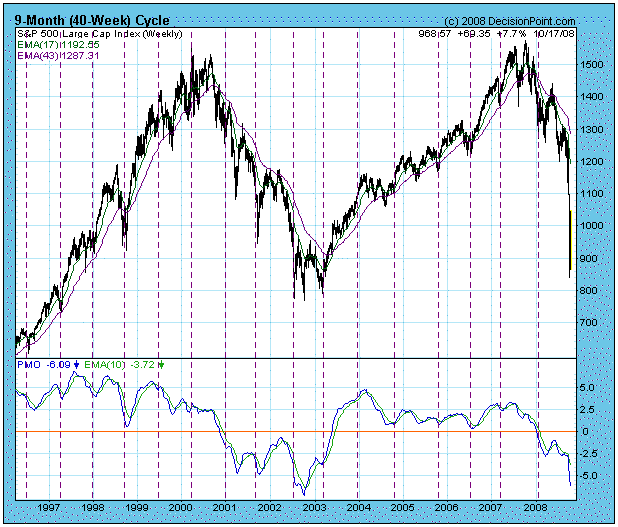
Finally, I am compelled to show you a chart of the 9-Month Cycles. My current projection for the next cycle low is October 22. As you can see, it is highly likely that the cycle low is already in as of last week, although we can never be sure except in hindsight. Nevertheless, the cycle chart is one more piece of evidence that we could be getting a sustainable rally at any time.
Bottom Line: The market is extremely oversold, and we have plenty of evidence that a rally is due. I do not for one minute believe the bear market is over, but it does not seem reasonable that the vertical descent will continue unabated. Reasonable? Perhaps that is not the best word to use in these circumstances. Let's just say that the technicals are screaming for a good sized bounce. Having said that, I will leave you with a reminder that we are playing by bear market rules. Oversold conditions are extremely dangerous and do not always present opportunities on the long side. Be careful!
