ChartWatchers November 16, 2008 at 11:06 PM
This has been one ugly bear season. It cannot be compared to anything else seen on the S&P 500 since 1950. Not even close. But I'll say one thing - there's an awful lot of horrible economic news priced into this market right now. I am convinced that the worst is behind us... Read More
ChartWatchers November 16, 2008 at 11:05 PM
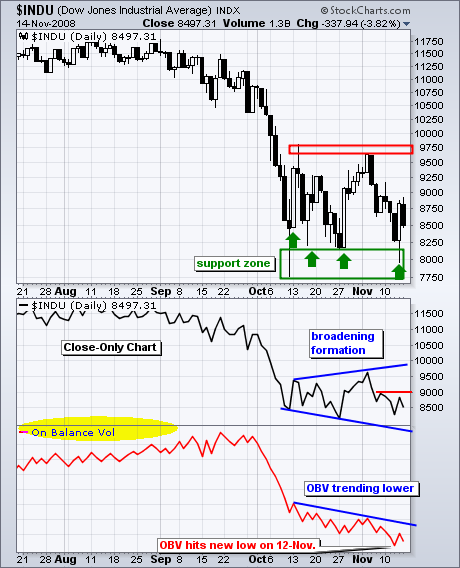
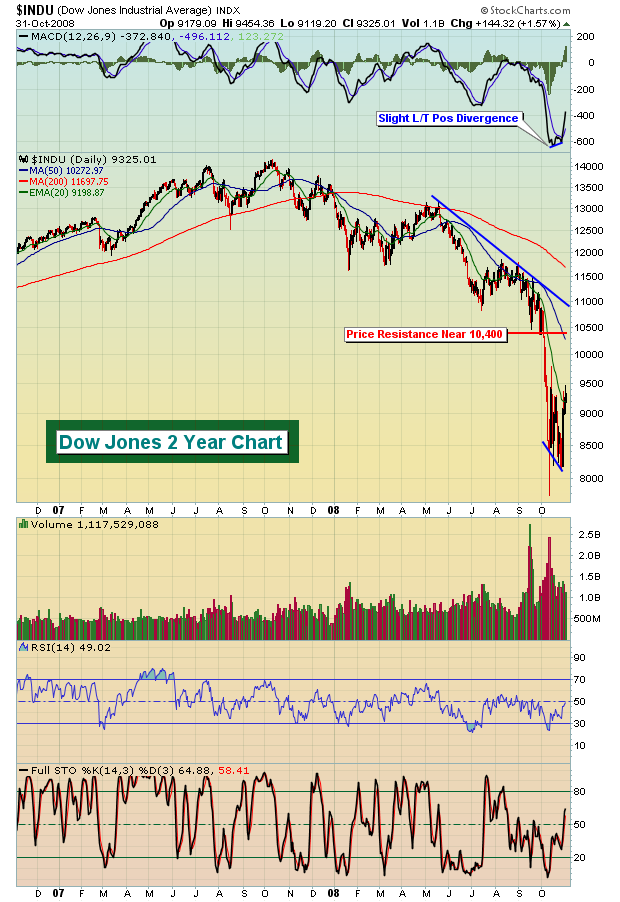
The Dow Industrials surged off support for the fourth time in five weeks. Will this bounce produce a breakout or failure? As the candlestick chart below shows, the Dow Industrials is locked in a volatile trading range with support around 8000 and resistance around 9700... Read More
ChartWatchers November 16, 2008 at 11:04 PM
Decision Point charts a couple of indicators that are useful in determining investor sentiment based on actual deployment of cash into Rydex mutual funds. The Rydex Asset Ratio is calculated by dividing total assets in Bear plus Money Market funds by total assets in Bull funds... Read More
ChartWatchers November 16, 2008 at 11:01 PM
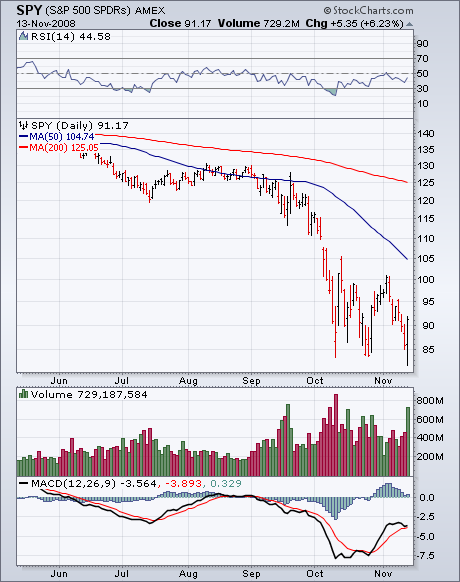
After dropping briefly to the lowest level since March 2003, the S&P 500 achieved an upside reversal day (as did all of the other major indexes) that resulted in a 6% gain. It also did that on the highest volume in weeks... Read More
ChartWatchers November 16, 2008 at 11:00 PM
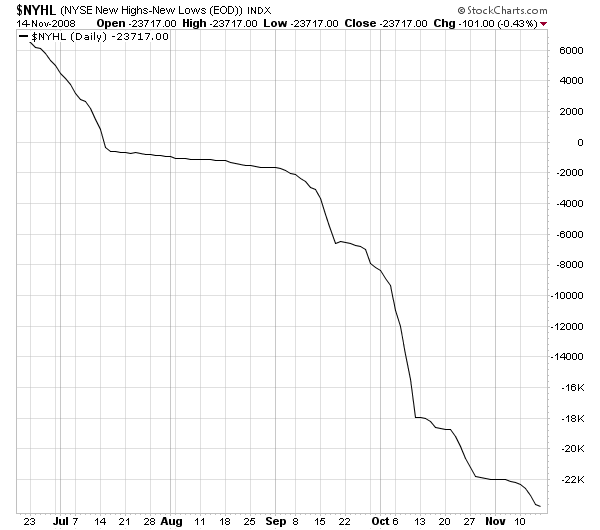
StockCharts.com is all about visually representing what's going on in the markets. Here's a sobering visual representation for you: Daily NYSE High-Low Line: Weekly NYSE High-Low Line: You can view these two charts anytime at http://stockcharts.com/charts/gallery... Read More
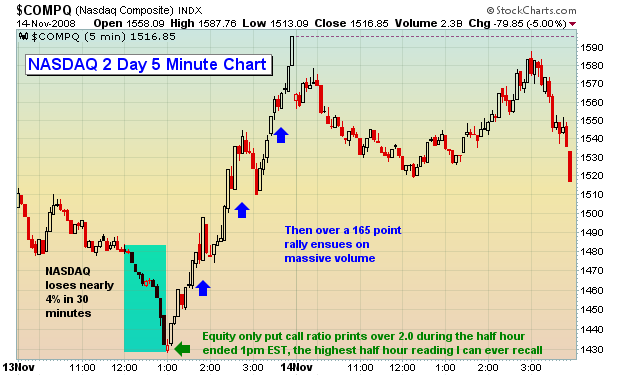
ChartWatchers November 02, 2008 at 11:05 PM
Previously, I've mentioned a favorite indicator of mine - The Bowley Trend. The Bowley Trend is an analysis of stock market history, dating back to 1950 on the S&P 500 and 1971 on the NASDAQ... Read More
ChartWatchers November 02, 2008 at 11:04 PM
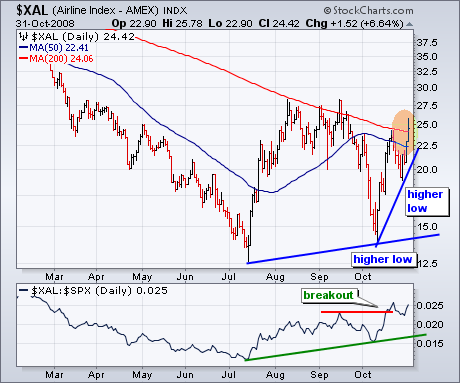
The Amex Airline Index ($XAL) is leading the market higher with a break above two key moving averages this week. XAL produced one of the sharpest October recoveries with surge from 14 to 25 over the last three weeks... Read More
ChartWatchers November 02, 2008 at 11:03 PM
When the market changes, we must change our tactics, strategies, and analysis techniques to accommodate the new market conditions. This is not a new idea, but it is one that is not very widely recognized, particularly when applied to the long-term... Read More
ChartWatchers November 02, 2008 at 11:02 PM
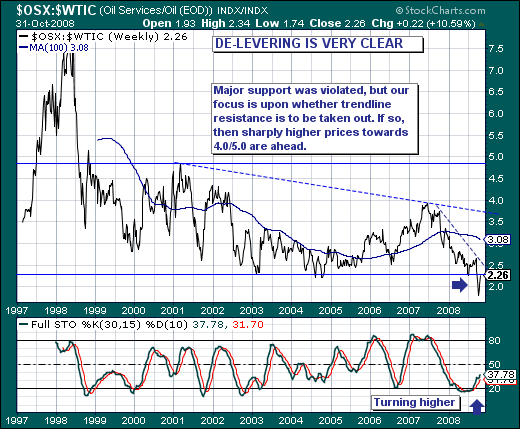
The world stock markets remain rather "volatile" as the credit crisis continues to unfold, while this volatility pendulum continues to create some very unique and interesting value propositions we haven't seen in quite some time... Read More
ChartWatchers November 02, 2008 at 11:01 PM
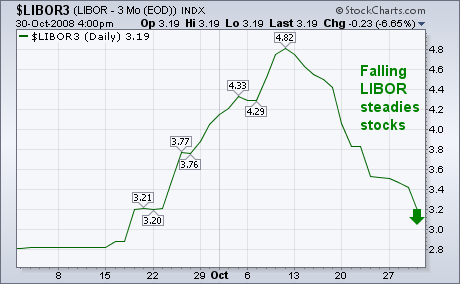
One of the recent positive trends is the continuing drop in the three-month London Interbank Overnight Lending Rate (LIBOR). That rate determines what banks charge each other for loans. During the credit freeze that started in mid-September, the LIBOR jumped from 2.8% to 4... Read More
ChartWatchers November 02, 2008 at 11:00 PM
Hello Fellow ChartWatchers, As you (hopefully) know already, StockCharts.com also has an online bookstore that is dedicated to providing great investment-oriented books at great prices. (We work hard to keep the prices as low as possible... Read More