The Amex Airline Index ($XAL) is leading the market higher with a break above two key moving averages this week. XAL produced one of the sharpest October recoveries with surge from 14 to 25 over the last three weeks. This surge carried the index above the 50-day moving average and 200-day moving average. Both moving averages are still moving lower, but this October surge shows extraordinary strength. Not too many indices are currently trading above their 200-day moving average. For example, the S&P 500 is some 30% below its 200-day moving average.
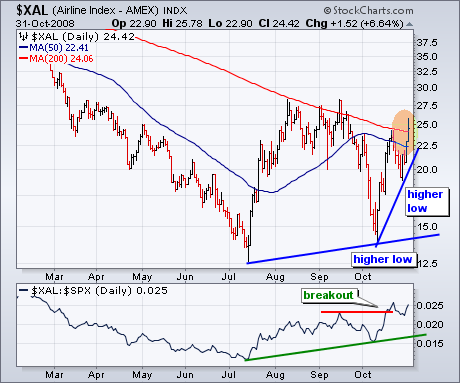
In addition to these moving average breakouts, XAL shows relative strength versus the S&P 500. First, the S&P 500 broke below its July low, but the Airline Index held above its July low. Second, the S&P 500 tested its mid October low last, but the Airline Index held well above its mid October low. These two higher lows show that the Airline Index is holding up better than the S&P 500. Third, the bottom indicator window shows the Price Relative, which shows the performance of XAL relative to SPX. This indicator formed a higher low in October and broke above its September high this month. A breakout in the price relative confirms relative strength in the Airline Index.
There is also a video version of the this analysis available at TDTrader.com - Click Here.
