This has been one ugly bear season. It cannot be compared to anything else seen on the S&P 500 since 1950. Not even close. But I'll say one thing - there's an awful lot of horrible economic news priced into this market right now. I am convinced that the worst is behind us. That doesn't mean we won't continue to see horrendous economic reports. This will be a holiday shopping season that every retailer in America had wished they could have skipped. We will see hundreds and hundreds of thousands of jobs lost in the coming months. As a result, home prices are nowhere near stabilizing yet. And without home prices stabilizing and economic improvement, banks aren't exactly sitting in the catbird seat either.
But the market prices these things in. That's why we've seen the NASDAQ drop 37.1% in the last 10 weeks. The S&P 500 and the Dow Jones aren't far behind, down 32.9% and 27.5%, respectively, during these last 10 weeks. The NASDAQ, from November 4th's close to the intraday low on November 13th, lost over 350 points, or 19.75%, in less than 7 trading days. Most technicians trying to time market bottoms using their trusty, dusty MACD's and OBV's and SUV's (oops, wrong story!), have erred miserably. They haven't worked with the precision most technicians have grown accustomed to. Instead, this wild market ride has been 100% about emotion. Sentiment indicators have worked like a charm. Two weeks ago, I commented that the VIX had just broken beneath its 20 day EMA for the first time in 2 months and that I was looking for a drop to 46. A couple days later, it hit 44 and change before bouncing again. Now the 50 day SMA on the VIX becomes an important level on a closing basis. Also, the put call ratio and the various moving averages that we use to identify "relative" complacency and pessimism have been of utmost importance in spotting key short-term reversals. Literally, on Thursday as we were wrapping up our noon chat and folks were exiting, I took a final look at the latest put call reading that was published at 1pm EST and it provided us with the final clue to start buying. The "equity only" put call ratio - during just one half hour reading - showed over 200,000 equity puts purchased and just 98,000 calls bought. That half hour ratio was over 2 to 1 in favor of puts, something I cannot ever recall seeing on the equity only reading. The market EXPLODED higher from 1pm on Thursday. Check out this 2 day chart on the NASDAQ:
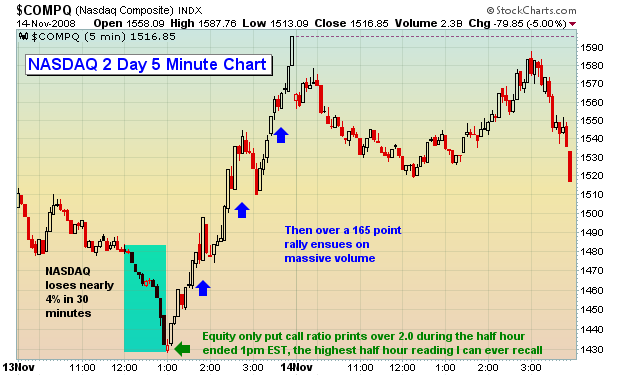
We recorded the last few minutes of that chat session on our website for anyone wishing to listen to my shock and dismay following that put call reading! Reviewing sentiment indicators like the put call provides opportunities that otherwise would be missed using standard technical indicators and it's why it's such a huge part of our trading arsenal.
The MACD (dare I say!) has turned decidedly bullish on the daily charts. We have a long-term positive divergence in place as shown below:
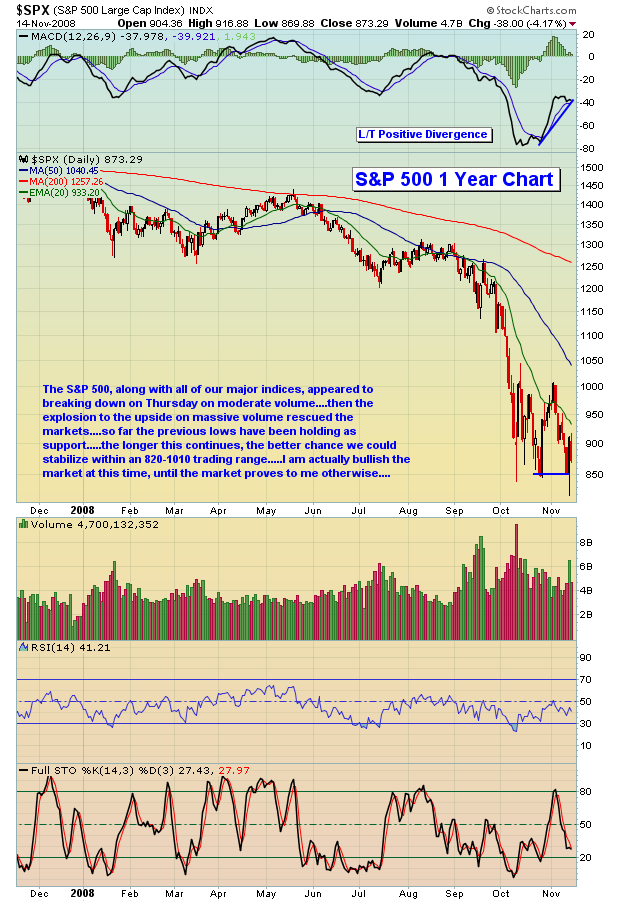
The market appears to be at or rapidly closing in on a tradeable bottom. We believe the risk/reward is such that aggressive traders could look to enter long positions in increments during further weakness. Let's not forget, this Friday is options expiration and MAX PAIN!!!
As always, keep those stops in place!
Happy trading!
