ChartWatchers December 14, 2008 at 11:05 PM
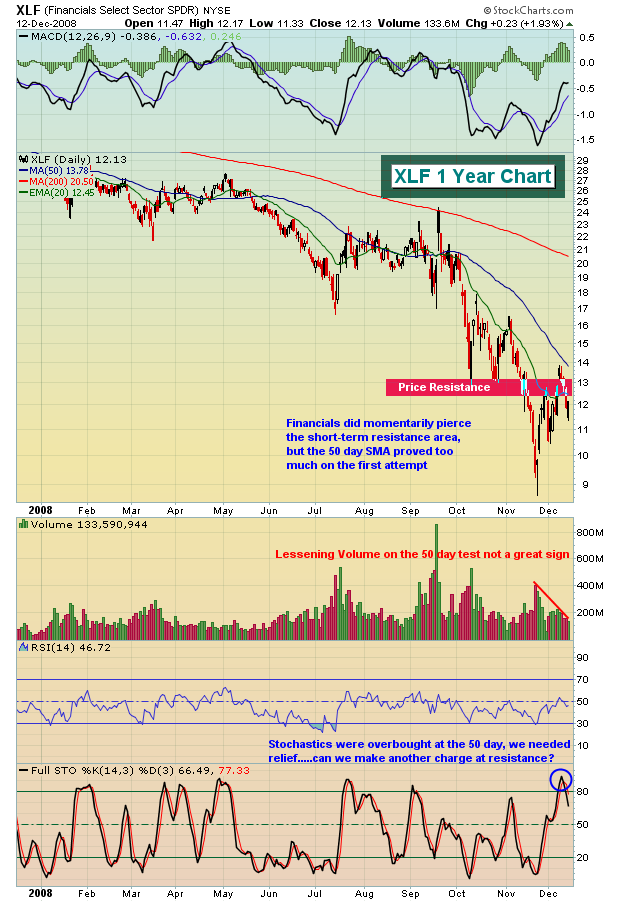
I knew eventually we'd get a rally with legs. The recent long-term positive divergences across our major indices suggested a 50 day SMA test was on the horizon and that's exactly what we saw this past week... Read More
ChartWatchers December 14, 2008 at 11:04 PM
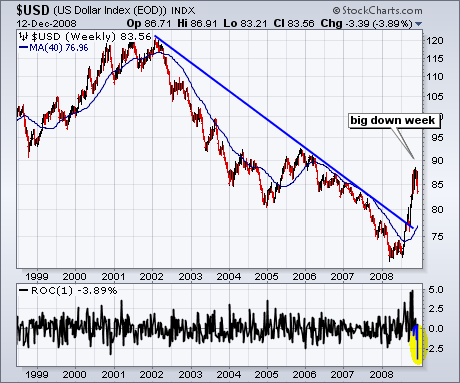
After surging from the low 70s to the upper 80s, the U.S. Dollar Index ($USD) experienced its sharpest decline in years. In fact, this week's decline was the sharpest in over 10 years. The bottom indicator window shows the 1-week Rate-of-Change dipping to -3.89% this week... Read More
ChartWatchers December 14, 2008 at 11:03 PM
Last week we looked at a descending wedge pattern on the S&P 500 chart that could have sparked a rally had it resolved to the upside. Prices actually did break upward, but volume was poor, and the up move stalled immediately... Read More
ChartWatchers December 14, 2008 at 11:02 PM
As we approach the end of the year, we find world stock markets attempting to trade a bit higher, although volatility remains quite high, but off it's worst high levels... Read More
ChartWatchers December 14, 2008 at 11:01 PM
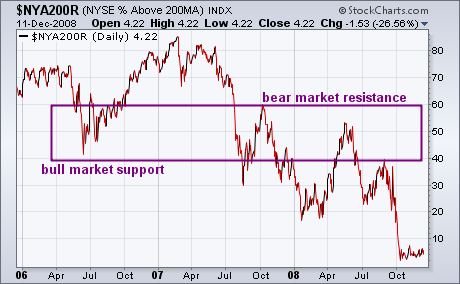
A reliable measure of the market's strength or weakness can be found in the % of NYSE stocks trading above their 200-day averages. That's because 200-day averages are used to measure a market's long-term trend. [A 50-day line measures short- and intermediate- market trends]... Read More
ChartWatchers December 14, 2008 at 11:00 PM
Hello Fellow ChartWatchers! Happy Holidays and welcome to our December issue of ChartWatchers. We only do one newsletter in December and so you can bet it's a good one... Read More