I knew eventually we'd get a rally with legs. The recent long-term positive divergences across our major indices suggested a 50 day SMA test was on the horizon and that's exactly what we saw this past week. Key indices hit resistance and, not surprisingly, backed away on the first attempt. The bears have been in the drivers seat for the last few months. They were not going to be taken down without a fight. The battle was waged and the bears were victorious - for now.
The market has stabilized somewhat and that's a positive. I wouldn't go so far as to say it's stable, just that it's in the process of stabilizing. Thursday afternoon's selloff occurred with the VIX barely budging higher. That's a critical sign that the fear and panic that ruled the market and ruined portfolios is not a major factor currently. Resiliency is a word often associated with the market now. Horrible news is being routinely ignored. The Employment report last Friday was worse than anyone could have predicted. Yet after a quick morning selloff, the major indices rallied. On Thursday evening, the Senate rejected the House's proposal on a $14 billion bailout package and futures were bleak. Asian markets tumbled overnight and given the late day selloff on Thursday, US investors were worried that another steep drop was upon us. But futures improved into the open and the major indices mostly rallied throughout the day, finishing in positive territory and near the highs of the day. It's that old adage, "sell on rumor, buy on news".
I am beginning to rely less on sentiment indicators as the market appears to be moving away from the emotional level of trading that we saw for many weeks. I expect to see more back and forth action once a range is established. That should set up for very profitable trades using momentum oscillators like stochastics and RSI. During the recent downtrend, the daily RSI has remained primarily below 50. If conditions are truly changing, we should see that oscillator begin to move back and forth between the key levels at 30 and 70. In sideways, consolidating markets, the stochastics and RSI oscillators can prove to be the most useful indicators for entry and exit points.
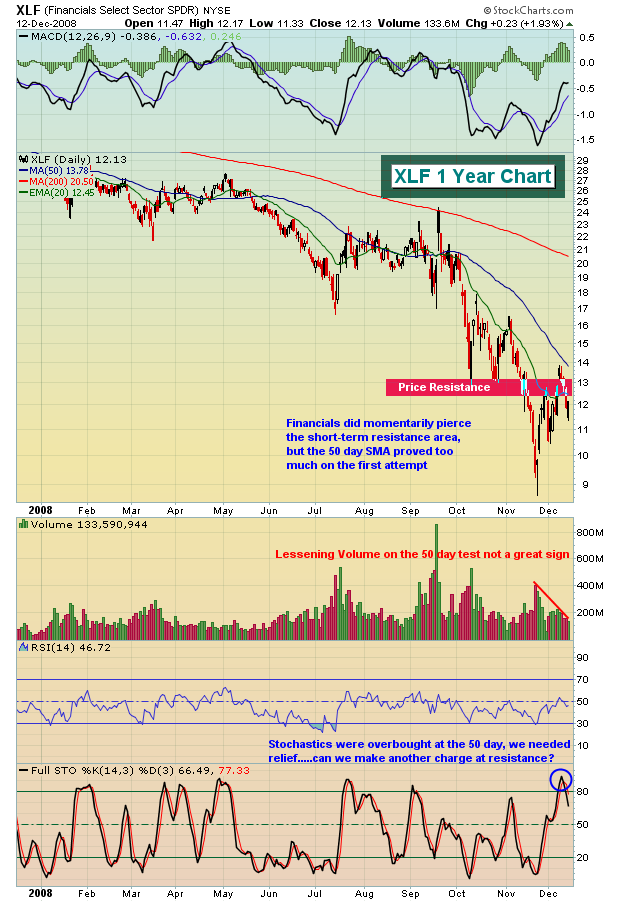
Technicals precede fundamentals. They always have and they always will. If you can follow the price action, you can trade the market. Will the recent bullishness last? Yes, it's quite possible. In fact, I'm watching for the highs on this current leg up to define our trading range over the next several months. While January 2008 was horrific for equities, the December-January timeframe is historically quite bullish. Financials are trying to repair themselves technically, but hurdles remain. As you can see from the chart of the XLF below, it's attempting to ascend past key short-term price and moving average resistance as reflected below:
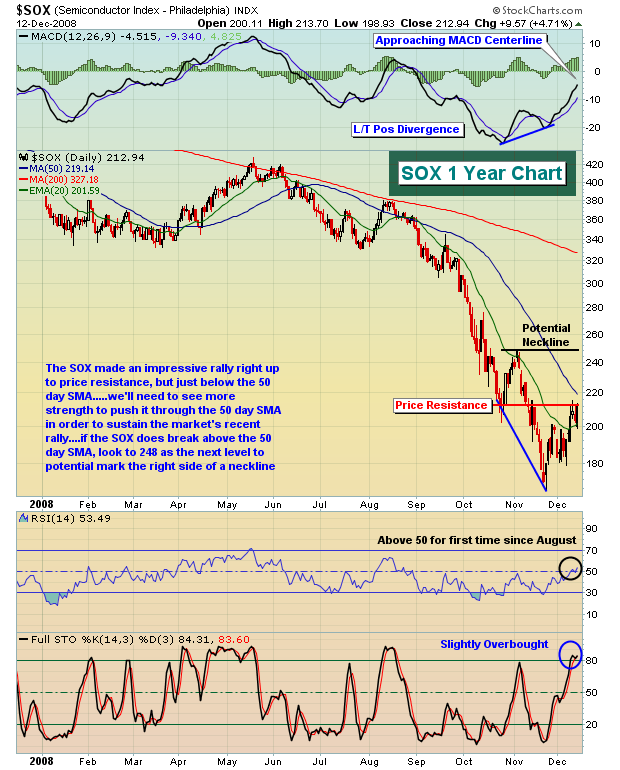
A move past key resistance will open the door to higher equity prices overall. Similarly, the SOX is also knocking at resistance's door as shown below in Chart 2:
These are two influential groups that will most likely need to participate in further strength in equities. Without them, this attempt could be futile.
I want to wish everyone a relaxing holiday season and a happy new year!
Happy trading!
