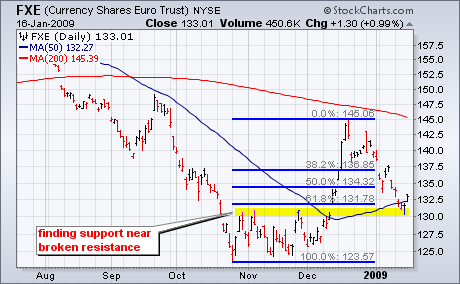
With a bounce on Friday, the Euro Trust ETF (FXE) found support from a confluence of indicators and chart features. First, broken resistance turns into support in 130-132 area. Second, there is support in this area from the 50-day moving average. Third, the decline over the last few weeks retraced around 62% of the prior advance. The ETF was also oversold after a rather sharp decline from 145 to 130. This combination of conditions and chart features made FXE ripe for a bounce.
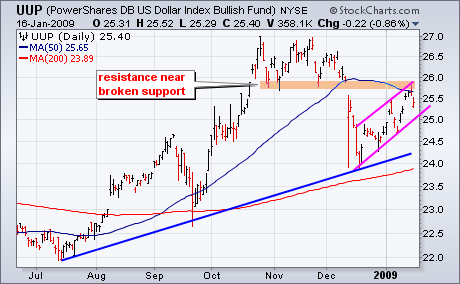
With the Euro bouncing, the US Dollar Index Bullish ETF (UUP) came under pressure on Friday. Notice that these two charts are mirror images of each other. After a surge over the last few weeks, UUP met resistance near broken support and the 50-day moving average. The advance in UUP looks like a rising flag, which is potentially bearish. For now, the flag is clearly rising as the trend has yet to actually reverse. A move below the early January low would break flag support and call for a continuation of the December decline.
There is also a video version of the this analysis available at TDTrader.com - Click Here.
