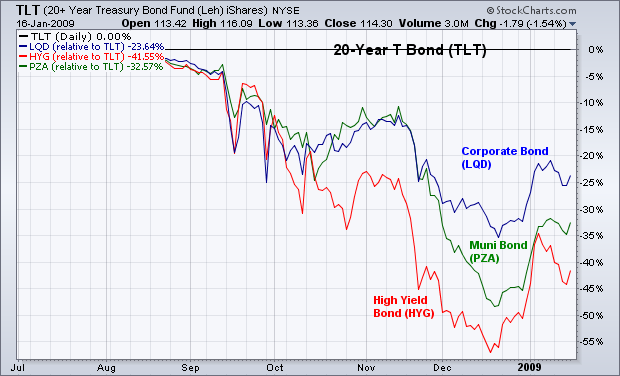
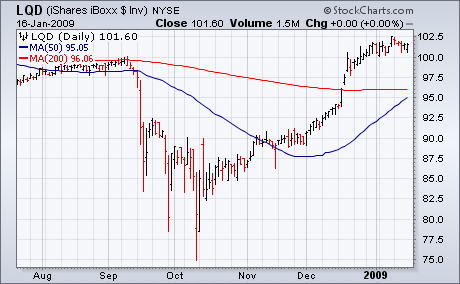
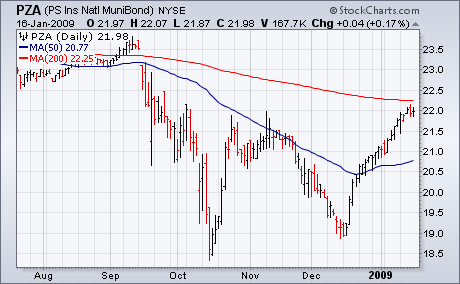
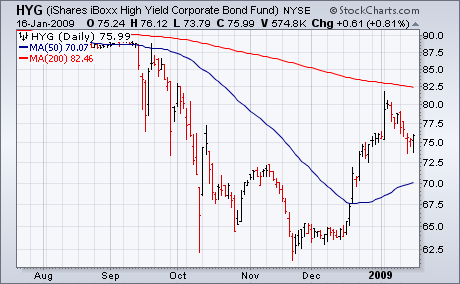
I recently wrote about how investment grade corporate bonds were starting to gain some ground on Treasury bonds. Today, I'm adding two other bond categories to that list. The flat line in Chart 1 is the 20+Year Treasury Bond iShares (TLT) which has been the strongest part of the yield curve over the past few months. That's been partly due to a flight to safety and deflationary concerns. The three other lines in Chart 1 are relative strength ratios versus the TLT. All three bond ETFs have been gaining ground on Treasury Bonds since mid-December. The strongest has been the LQD (blue line) which I wrote about in the earlier article. The next strongest is National Muni Bond Fund (PZA) which is the green line. The next in line is the High Yield Corporate Bond Fund (HYG). Charts 2 through 4 show what those bond ETFs look like. The LQD in Chart 2 is trading well above its 200-day line. The Muni Bond ETF (Chart 3) is testing that resistance line and its early November peak. Chart 4 shows the High Yield Corporate Bond ETF trading at a three-month high and nearing its 200-day line. For those who think that the recent surge in Treasury bond prices is overdone (I certainly do), these other bond ETFs offer some alternatives.