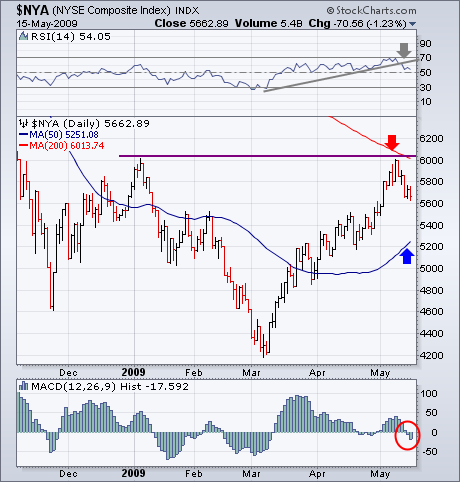
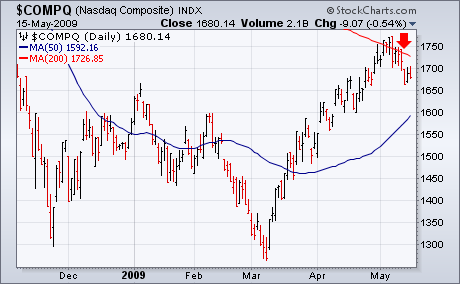
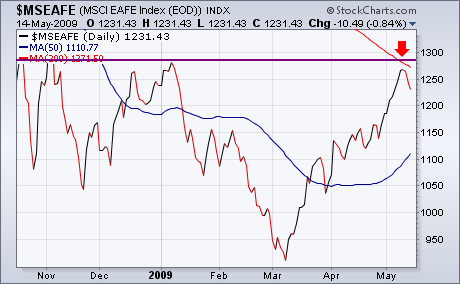
I started the week on Monday with the headline that "Upside price and time targets had been hit" and added that overbought readings suggested that the market was vulnerable to profit-taking. The NYSE Composite Index had just reached overhead resistance at its January high and its 200-day moving average as shown in Chart 1. A number of other indexes (like the Nasdaq Composite in Chart 2) and sector indexes were stalled at their 200-day moving averages as well. So were numerous foreign stock markets. Chart 3 shows the MSCI EAFE (Europe Australasia and Far East) Index stalled at its January high and 200-day line. It was no surprise then to see global stocks selling off this week. When a market has rallied too far and is ripe for profit-taking, some fundamental trigger usually starts things off. A weak retail report on Wednesday caused stocks to sell off on heavy volume and got the correction started. After a modest bounce on Thursday, stocks fell again on Friday. The result was a weekly loss for all of the major stock indexes. I also suggested that a pullback to the 50-day moving average was likely and could be part of "right shoulder" in a bottoming formation. Arthur Hill expanded on that idea during the week. In addition to some fundamental trigger, there are technical triggers as well. Chart 1 shows two examples. The 14-day RSI line (top of chart) broke its two month support line after reaching overbought territory at 70. The MACD histogram bars (below chart) turned negative (red circle). There were other technical triggers as well.


