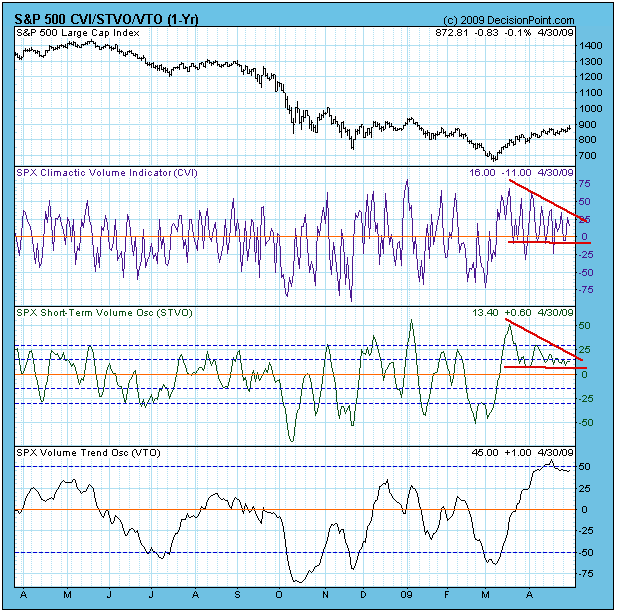
I have been referring to the slow, steady advance of the last few weeks as a "correction". To be more specific, it is a "running correction", which means that prices have moved higher as indicators have chopped sideways and lower. This is evident on the chart below which shows the CVI and STVO (two short-term volume indicators). The CVI has been oscillating above the zero line in an ever-narrowing range for almost two months. The STVO is almost become a flat line. This kind of indicator activity is very unusual, and the impression I get when I look at the charts is that it is not likely to last much longer.
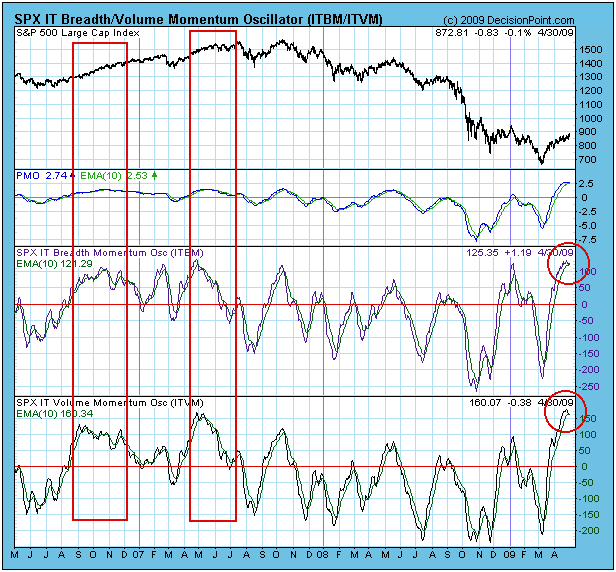
Looking at the medium-term breadth and volume indicators below, I am concerned that the overbought conditions are so extreme and the indicators have just barely topped. This condition must be cleared, but it doesn't necessarily need to be cleared by a big price decline. Looking to the left side of the chart, you can see two instances where overbought conditions were cleared as the market moved higher. I believe we will see a similar resolution this time.
Bottom Line: We are in a long-term bear market, but we also have a medium-term buy signal, which means that bull market rules apply at the present time. Market action has been persistently positive since the March price low, and overbought conditions are most likely to clear in a non-destructive way.


