It looks like you can throw out most of what I wrote last Friday. I was expecting a deeper market correction after most market indexes broke short-term head and shoulder "necklines" (and daily EMA lines turned negative). I also wrote about the possible threat from a rally in the CBOE Volatility (VIX) Index. It turns out I was wrong on both counts. Stocks rallied strongly and the VIX touched a new low.
Although some readers have asked if the current rally could be just another "right shoulder", I'm somewhat doubtful. A retest of the June high at 956 looks more likely. The fact that the technology-dominated Nasdaq market has already exceeded that high is also influencing a rising market. That doesn't rule out the possibility for a market correction later in the summer or the autumn. This week's upturn, however, has postponed that possibility for the time being.
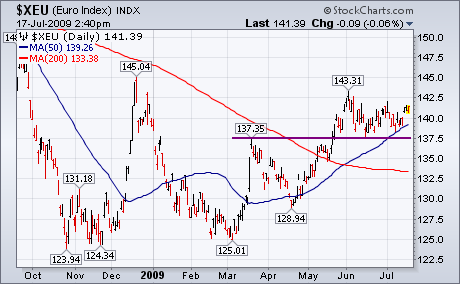
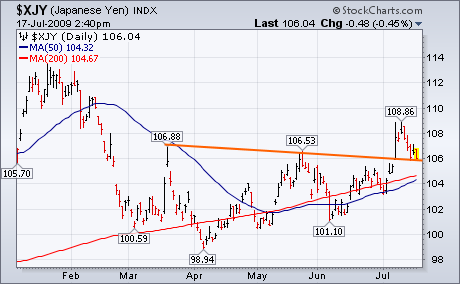
I also wrote that a dollar rally would most likely coincide with a stock pullback. The reverse happened. The dollar dropped as most foreign currencies rose (except for the yen). Chart 1 shows the Euro bouncing off chart support near 137.5 and its 50-day moving average. The Euro has the biggest influence on the dollar. The Euro has also had a positive correlation to stocks since March. The week's bounce kept its March uptrend intact which helped stocks as well. The Japanese yen (which rallied the previous week on safe haven buying) pulled back this week as stocks bounced. Chart 2 shows the XJY retesting its neckline near 106. A close back below that support line would be positive for stocks.


