ChartWatchers November 22, 2009 at 01:38 AM

Hello Fellow ChartWatchers! I have two big announcements for you this time around: OUR HOLIDAY SPECIAL IS NOW ON! With the holiday season just around the corner, we've fired up our Holiday Special. It's a great way for you to join up or extend your StockCharts... Read More
ChartWatchers November 21, 2009 at 06:56 PM
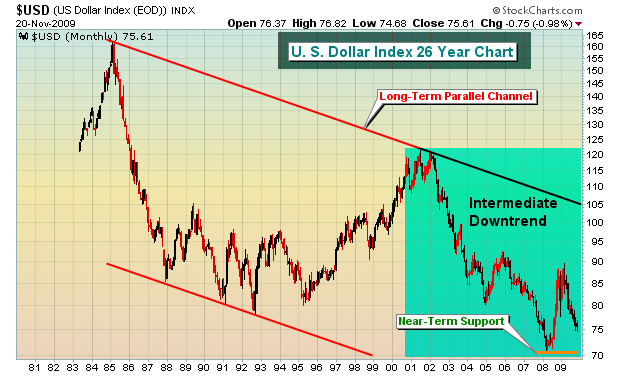
While there are lots of questions surrounding the sustainability of the stock market advance, there seems to be little resistance ahead for commodities, specifically gold and silver. The U.S. dollar is the primary variable... Read More
ChartWatchers November 21, 2009 at 06:52 PM
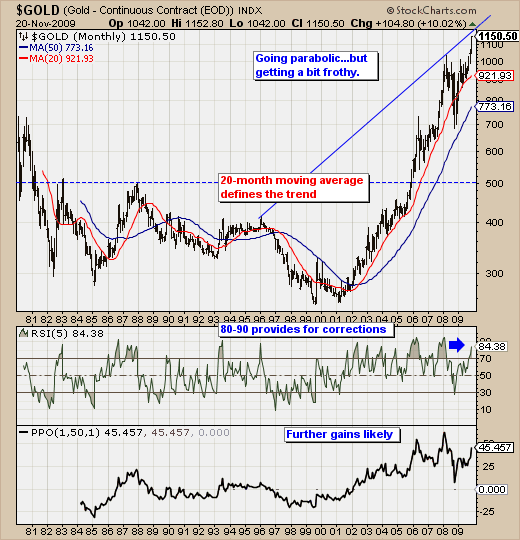
Gold prices are obviously rising, and they are rising rapidly. However, given the move has begun to go parabolic in its 8-year of rally - we have to question how much higher gold prices can go in both the short and intermediate-term... Read More
ChartWatchers November 21, 2009 at 10:23 AM
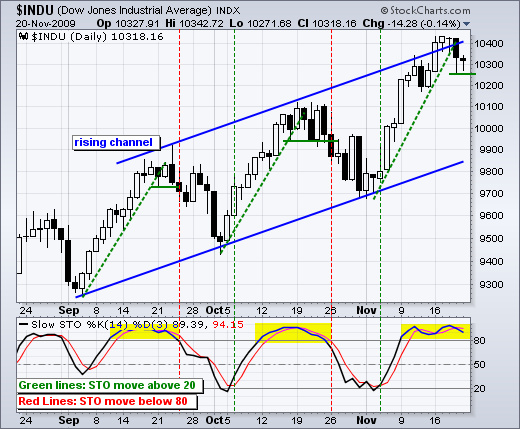
The Dow has been moving higher the last three months with surges early in the month and pullbacks later in the month. Notice how the Dow bottomed in early September, early October and early November. Also notice how the Dow peaked in mid September and mid October... Read More
ChartWatchers November 20, 2009 at 08:33 PM
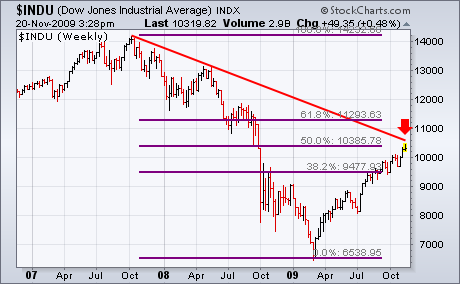
The following three charts show the three major U.S. stock indexes having reached formidable overhead resistance barriers. Charts 1 and 2 show the Dow Industrials and the S&P 500 having retraced 50% of their bear market declines... Read More
ChartWatchers November 20, 2009 at 08:27 PM
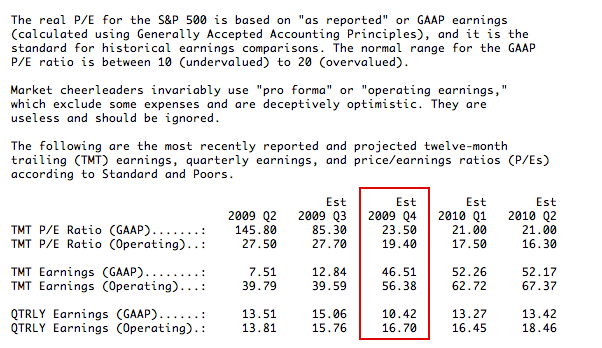
Stocks have been in the overvalued end of the normal P/E range since the early-1990s, and this condition shows no sign of abating. Below is an excerpt from our daily earnings summary that will offer readers a better perspective... Read More
ChartWatchers November 08, 2009 at 01:19 AM
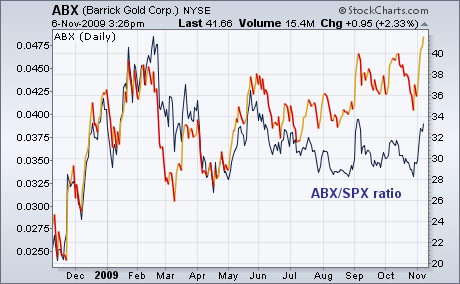
With gold hitting new record highs each day, gold stocks are starting to play catch-up. Two of the biggest are at or very close to hitting new 52-week highs. Chart 1 shows Barrick Gold closing at a new 52-week high today... Read More
ChartWatchers November 08, 2009 at 12:31 AM
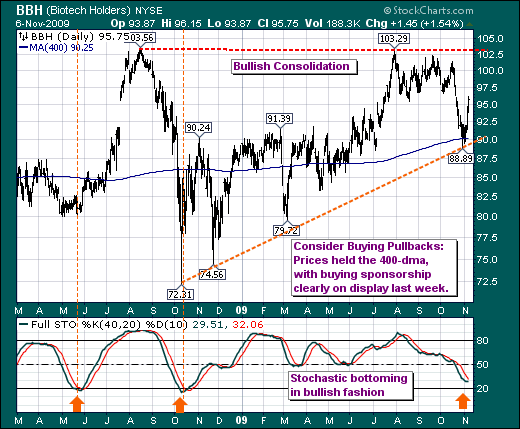
We find it rather interesting that the laggard Biotechnology group and the Biotechnology ETF (BBH) in particular have begun to find sponsorship; and it is our opinion that BBH is set to embark upon a period of both absolute and relative out-performance... Read More
ChartWatchers November 08, 2009 at 12:26 AM
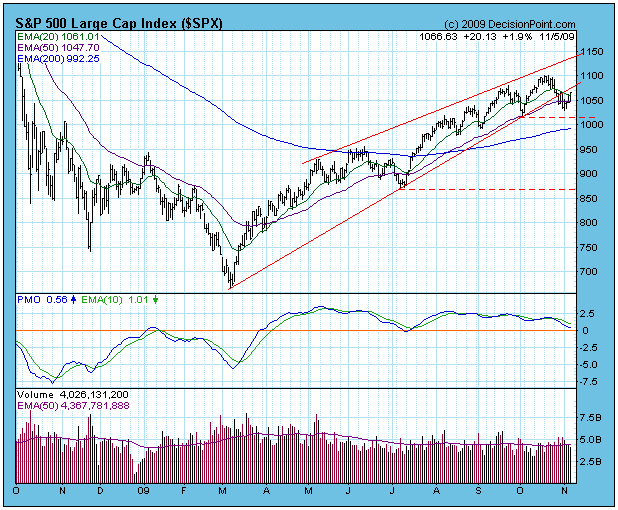
Looking at the S&P 500 chart below, the breakdown from the ascending wedge pattern is clear enough, and expectation of the breakdown has been fulfilled... Read More
ChartWatchers November 08, 2009 at 12:21 AM
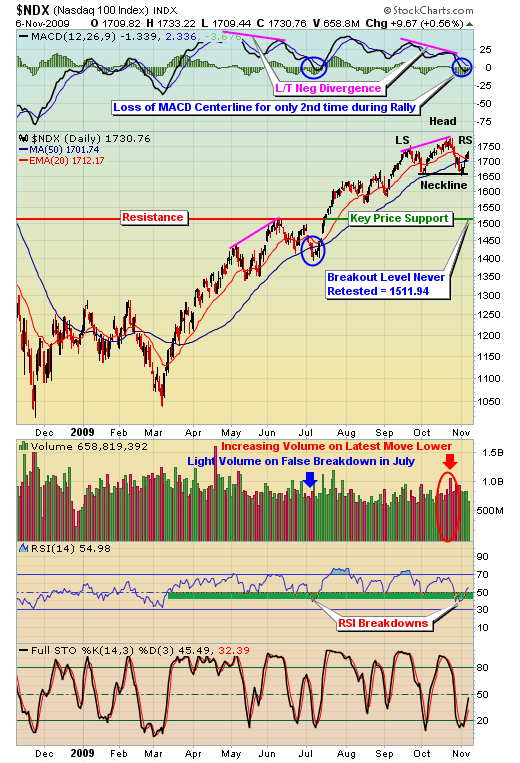
In my latest article on October 18, I provided a very cautious tone but noted that volume trends remained strong - good news for the bulls! Well, short-term volume trends now have turned negative, though the really key long-term price support levels remain intact... Read More
ChartWatchers November 07, 2009 at 09:51 PM
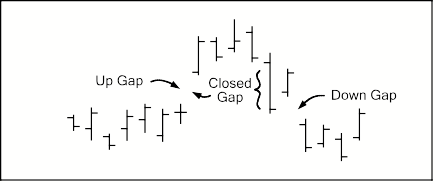
This is the next part of a series of articles about Technical Analysis from a new course we're developing. If you are new to charting, these articles will give you the "big picture" behind the charts on our site... Read More
ChartWatchers November 07, 2009 at 10:34 AM
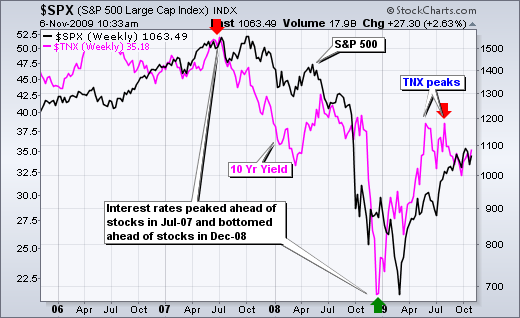
The 10-Year Treasury Yield ($TNX) is largely positively correlated with the S&P 500 - and also shows a propensity to lead the stock market. The chart below shows the 10-Year Treasury Yield peaking in July 2007 and stocks peaking in October 2007, three months later... Read More