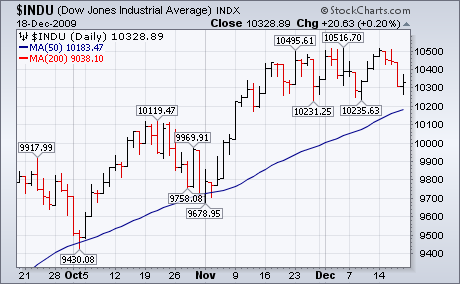
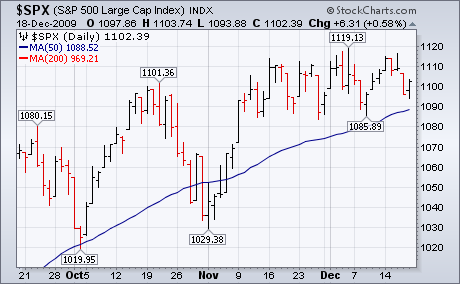
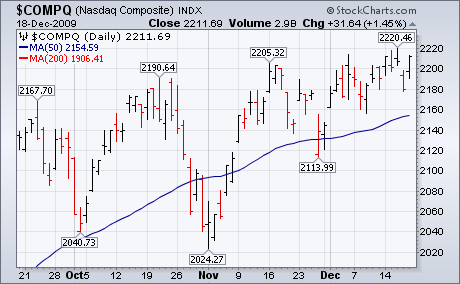
A Friday stock bounce kept major stock indexes stuck in a two-month trading range. Prices also remain above their 50-day averages which keeps the intermediate uptrend intact. Prices, however, remain below long-term resistance barriers near 10,500 in the Dow, 1120 in the S&P 500, and 2200 in the Nasdaq Composite. Although not shown here, today's unusually heavy trading is due to quarterly futures and options expiration as well as some index rebalancing. It has little forecasting value. A modest pullback in the U.S. Dollar also provided some short-term relief to stocks and commodities. Gold and oil ETFS (GLD and USO) bounced off their 50- and 200-day moving averages respectively. Stocks may also be benefiting from a favorable seasonal pattern. Not only is December a strong month seasonally, but a late-month bounce (known as the Santa Claus rally) may still lie ahead. That may not be enough to push stocks out of their trading range, but should be enough to prevent them from dropping much. Stock traders appear to be satisfied with protecting their 60% gains in 2009, and don't appear in the mood for taking on new risks. That also argues for a trendless market through yearend. Treasuries bonds and notes lost ground on fears that long-term rates are headed higher in the new year.


