ChartWatchers February 21, 2010 at 06:28 PM
Hello Fellow ChartWatchers! Last time I talked about the great lengths that we go to here at StockCharts.com to make sure that our indicator values are calculated correctly... Read More
ChartWatchers February 21, 2010 at 12:31 AM
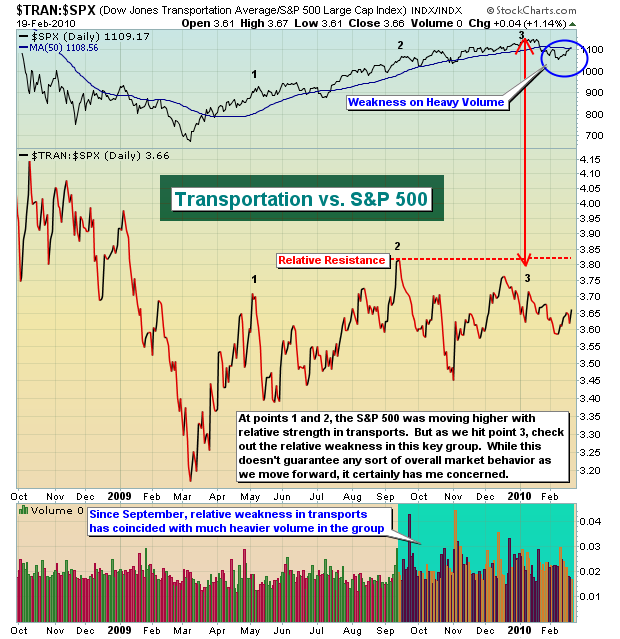
History is a valuable tool in the stock market as we witness cycles repeating themselves all the time. Our major indices and the various sectors and industries rotate back and forth as our economy moves from strength to weakness and back to strength again... Read More
ChartWatchers February 20, 2010 at 03:48 PM
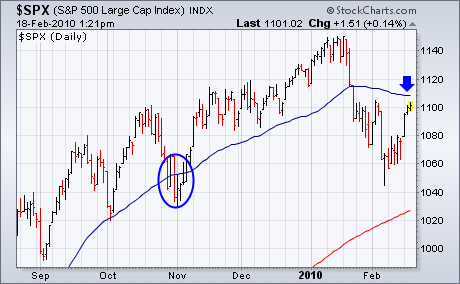
One of our readers recently pointed out that the blue 50-day moving average is declining for the first time since last March, and asked if that makes it more of a resistance barrier. The short answer is probably... Read More
ChartWatchers February 20, 2010 at 03:43 PM
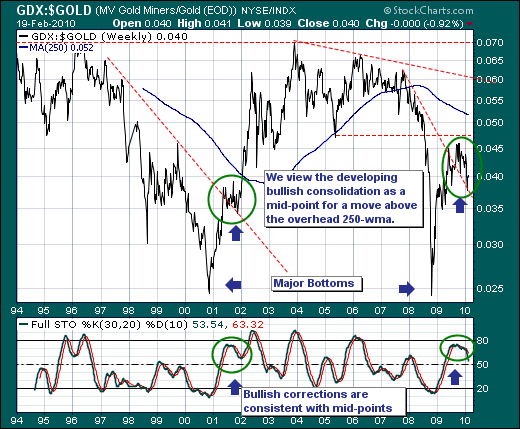
The Gold Futures ($GOLD) market has begun to capture traders' attention once again, for the developing technical patterns would suggest new highs above $1225/oz will materialize in the months ahead... Read More
ChartWatchers February 20, 2010 at 03:40 PM
Last week we were looking at a bearish reverse flag formation, but this week prices broke above a short-term declining trend line, effecting a bullish resolution of the flag and changing the short-term outlook to bullish... Read More
ChartWatchers February 19, 2010 at 07:54 PM
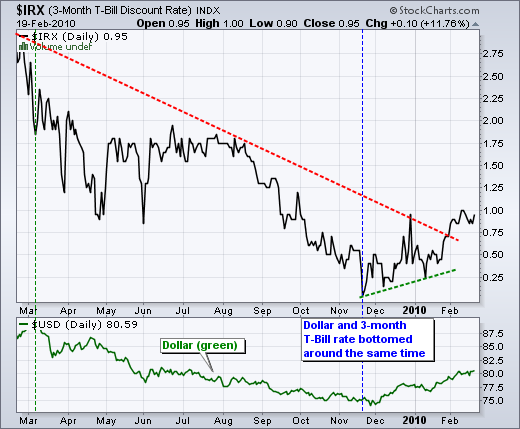
With a quarter point hike in the discount rate, the Fed surprised some in the media, but few in the bond market. As one of the most interest rate sensitive asset classes, the bond market often moves before an actual Fed move... Read More
ChartWatchers February 07, 2010 at 03:41 PM
Hello Fellow ChartWatchers! Here at StockCharts we are fanatical about accuracy. Without accuracy, there would be no reason to use our website. We work hard at it every day... Read More
ChartWatchers February 06, 2010 at 11:24 PM
Relax Chicago. You're not in the Super Bowl this year. I'm just applying a little Super Bowl-mania to the current state of the stock market. The bears are calling the plays. From a sentiment and technical perspective, this market is really making sense right now... Read More
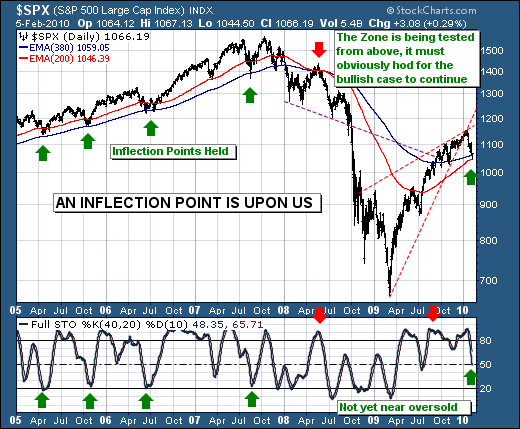
ChartWatchers February 06, 2010 at 04:06 PM
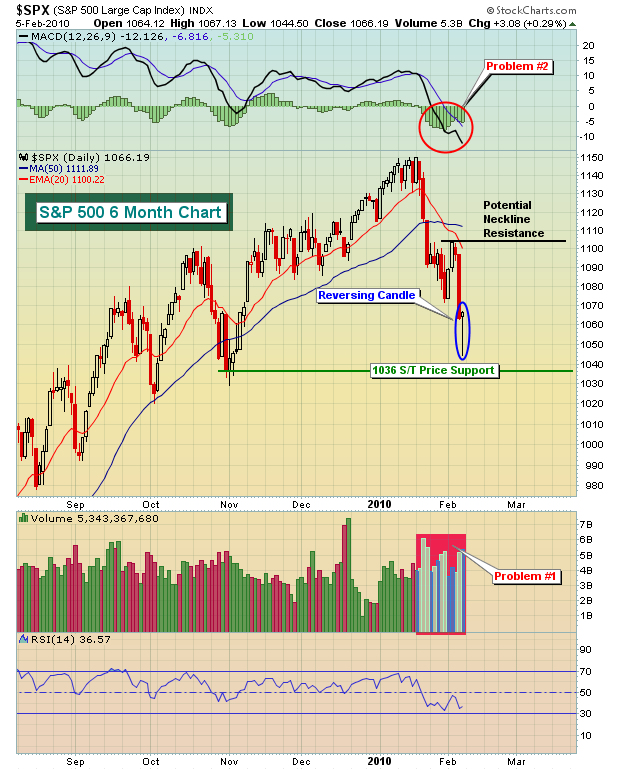
The stock market remains in a downside correction as evidenced by the breaking of initial support levels and negative turns in several longer-term technical indicators (more on that later)... Read More
ChartWatchers February 06, 2010 at 04:02 PM
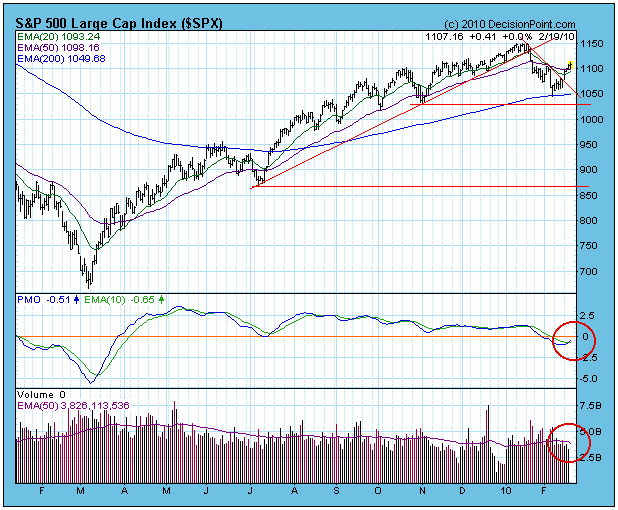
On Thursday our mechanical Thrust/Trend Model changed from a buy to neutral, based upon the 20-EMA crossing down through the 50-EMA. Now our hope is that there will be enough continuing decline to cover what may turn out to be a whipsaw signal... Read More
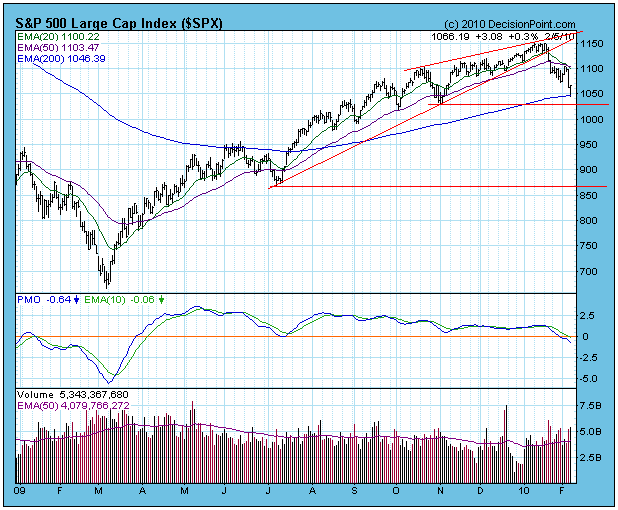
ChartWatchers February 06, 2010 at 03:59 PM
Last week's S&P decline reached a crescendo on Friday around mid-day at 1044.50, which brings the decline to roughly 106 S&P points from the January 19th high at 1150.42. Pencil to paper, and the decline stands at -9... Read More
ChartWatchers February 05, 2010 at 02:53 PM
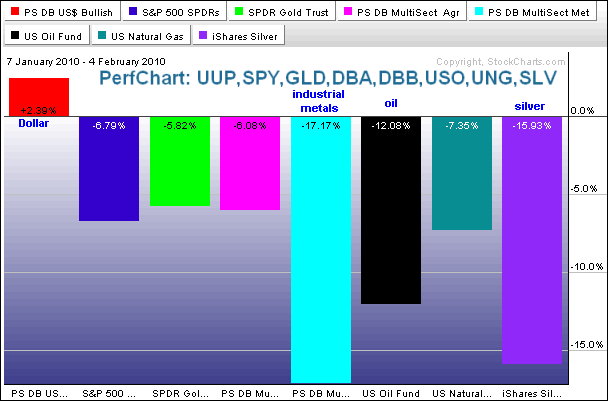
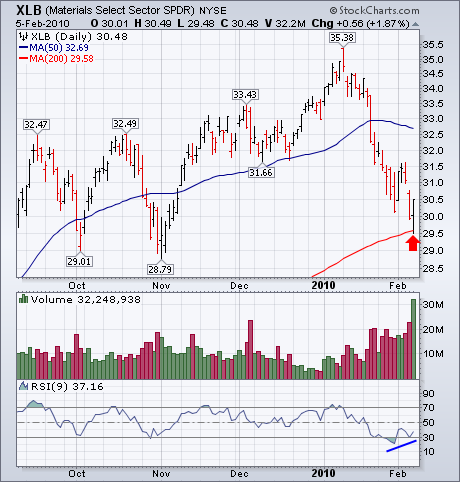
In addition to stock markets around the world, we have seen a rout in various commodity groups over the last 3-4 weeks. Strength in the Dollar is partly to blame. Weakness in global equities also bodes ill for the commodities... Read More