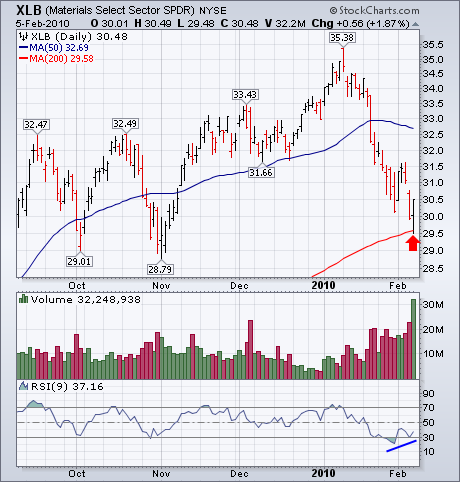
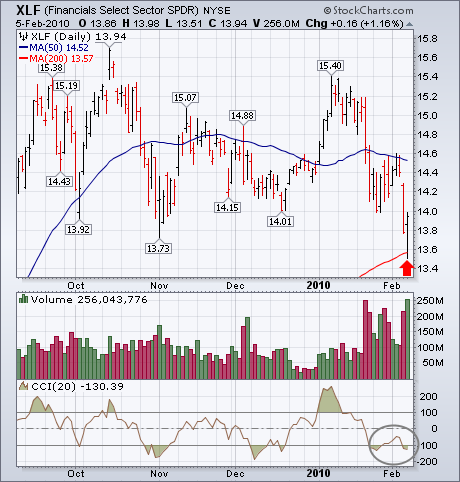
The stock market remains in a downside correction as evidenced by the breaking of initial support levels and negative turns in several longer-term technical indicators (more on that later). Friday's heavy-volume upside reversal, however, suggests that a short-term bottom may have formed from an oversold condition. That's especially true of two sector ETFs that bounced off their 200-day moving averages. Material stocks have been among the hardest hit because of the sharp selloff in commodity markets. Chart 1, however, shows the Materials Sector SPDR (XLB) reversing upward on Friday (on huge volume) after touching its 200-day line. Its 9-day RSI line (below chart) shows slight "positive divergence" from an oversold condition below 30. The chart picture for the Financials SPDR (XLF) in Chart 2 looks weaker owing to its having broken its fourth quarter lows. But it too bounced impressively off its 200-day line. The Commodity Channel (CCI) Index is also in oversold territory. That helped launch the late rebound on Friday.


