ChartWatchers March 21, 2010 at 02:05 PM
Hello Fellow ChartWatchers! The markets continue to rise impressively with the Dow closing higher for 13 of the last 16 days. Arthur, John and the rest of the ChartWatchers team discuss that in more detail in just a bit... Read More
ChartWatchers March 20, 2010 at 11:55 PM
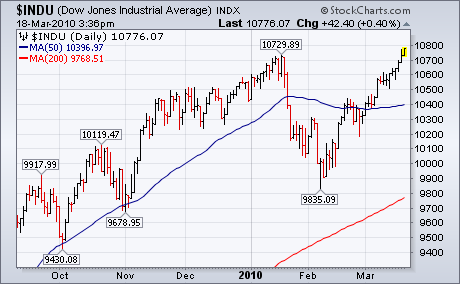
Dow Theory holds that the Dow Transports and Industrials must both hit new highs to confirm an ongoing bull market. The ability of the Dow Industrials to exceed their January high has done just that. That doesn't tell us how far the bull market will run, or for how long... Read More
ChartWatchers March 20, 2010 at 11:51 PM
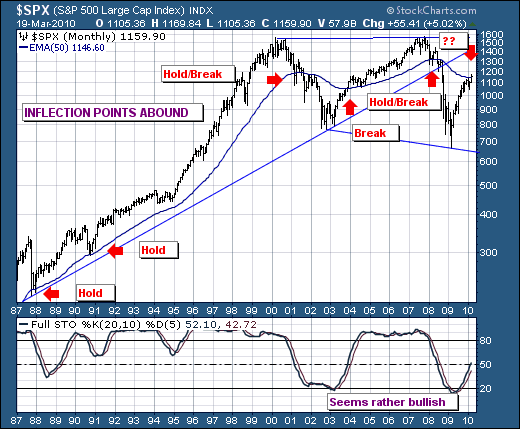
The recent S&P rally to new reactionary highs has shown to be on rather slim-footing given that volume patterns are rather tepid... Read More
ChartWatchers March 20, 2010 at 11:48 PM
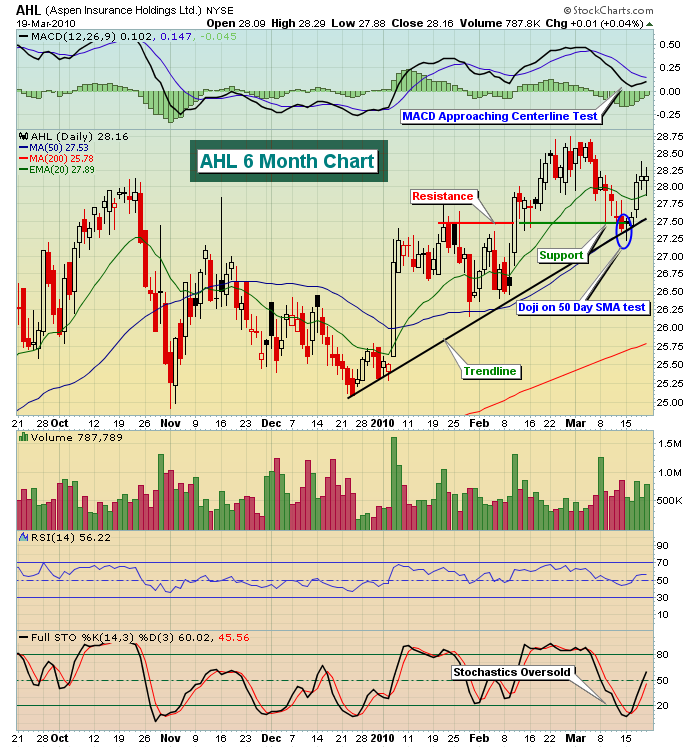
Candlesticks and candlestick patterns are the foundation to trading in my view. I use them on every charting timeframe, whether it's a one minute, hourly, daily, weekly or monthly chart... Read More
ChartWatchers March 20, 2010 at 11:45 PM
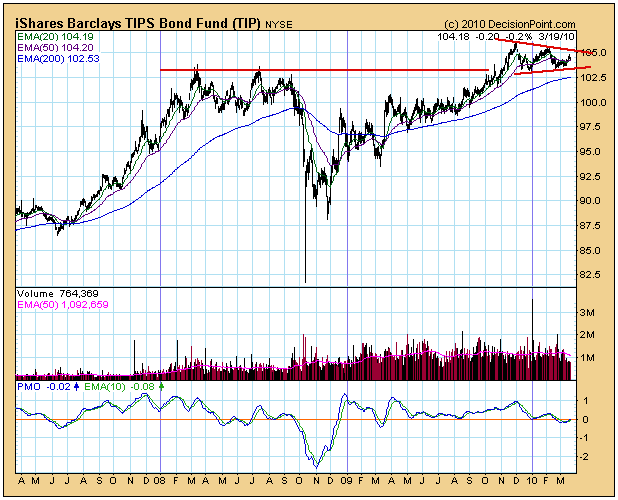
TIPS are bonds that provide inflation protection. While Erin covered this subject in yesterday's blog, I wanted to cover it with a little more depth and from a somewhat different perspective... Read More
ChartWatchers March 20, 2010 at 10:38 AM
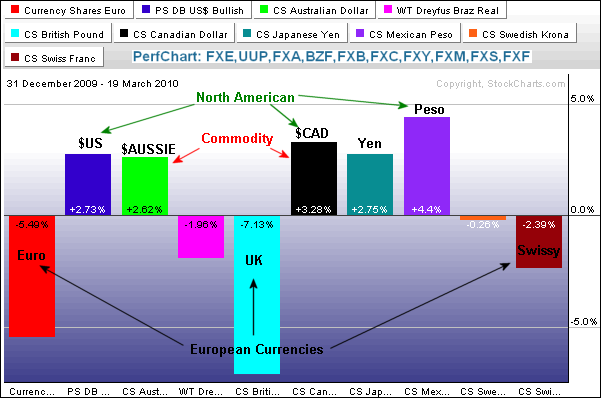
The Perfchart below shows the performance trends for 10 currency ETFs in 2010. The North American and commodity currencies are strong, while the European currencies are weak... Read More
ChartWatchers March 07, 2010 at 02:21 PM
Hello Fellow ChartWatchers! We've been working hard the past couple of weeks to get better Sector and Industry classifications for the stocks in our database and today that work is finally starting to surface on the web site... Read More
ChartWatchers March 06, 2010 at 09:00 PM
Richard will return for our next issue... Read More
ChartWatchers March 06, 2010 at 08:57 PM
Happy Anniversary! It was one year ago, on March 6, 2009, that the S&P 500 made that unforgettable 666 low, completing an amazing drop from above 1300 in August 2008. That represented nearly a 50% decline in the market capitalization of 500 of the largest U.S... Read More
ChartWatchers March 06, 2010 at 04:58 PM
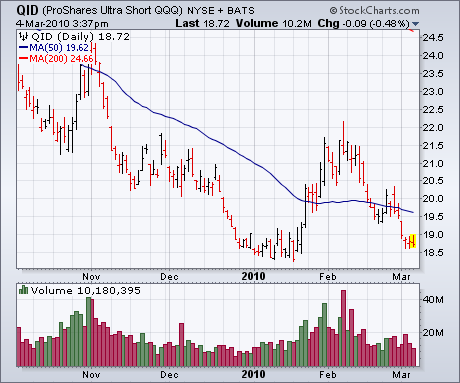
A number of readers have asked why I haven't said much about inverse (or bear) ETFs. The main reason is that I wasn't convinced that the recent market dip was serious enough to warrant bearish positions. So far, that view has been justified... Read More
ChartWatchers March 06, 2010 at 04:47 PM
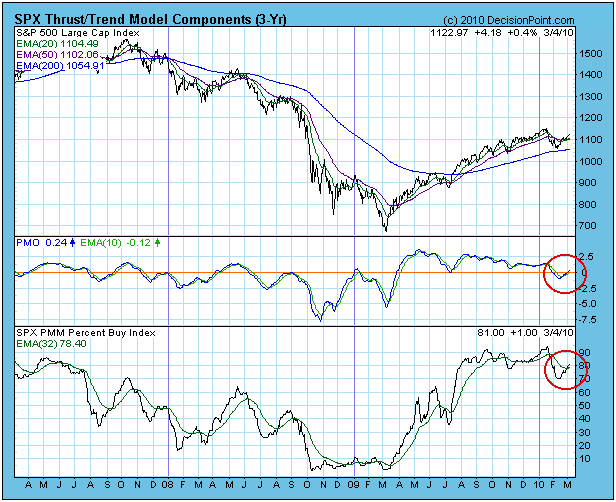
Looking at the S&P 500, a new Thrust/Trend buy signal was generated on Monday, changing from a neutral stance. Specifically, the signal was generated by the PMO (Price Momentum Oscillator) and PBI (Percent Buy Index) crossing up through their EMAs... Read More
ChartWatchers March 06, 2010 at 12:04 PM
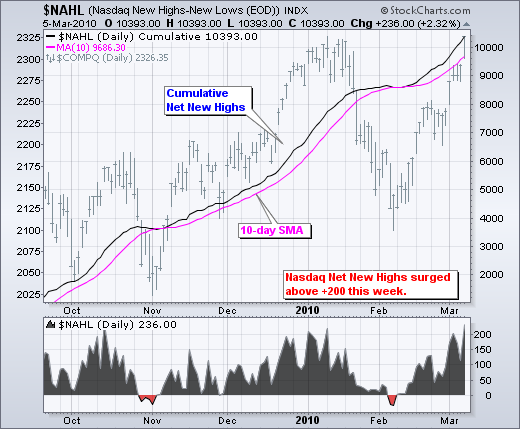
Net New Highs survived their third corrective period and surged over the last few weeks. The chart below shows Nasdaq Net New Highs surging back above +200 this week. Prior surges in October and early January hit the +200 area... Read More