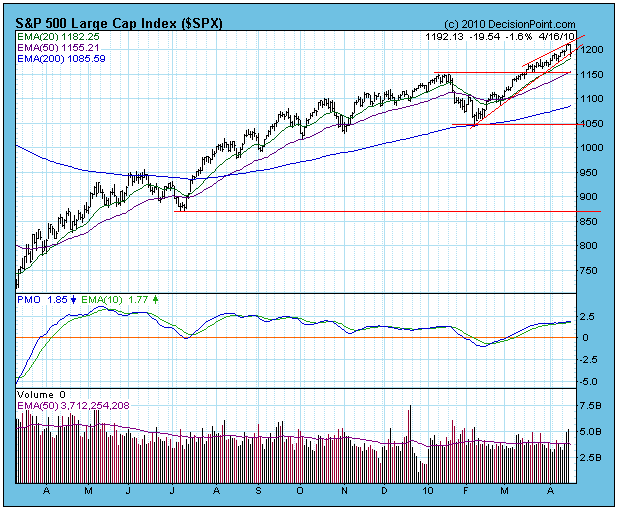
STOCKS: Based upon a 3/1/2010 Thrust/Trend Model buy signal, our current intermediate-term market posture for the S&P 500 is bullish. The long-term component of the Trend Model is on a buy signal as of 8/11/2009.
On Wednesday the S&P 500 broke up and out of the short-term ascending wedge pattern on expanding volume. On Thursday there was a small follow through advance on expanding volume, but short-term internals showed weakness, and it looked to me as if a pullback toward the point of breakout was likely. Instead, the breakout was a fakeout, and prices fell through support all the way back to the short-term rising trend line. At this point no damage has been done to the technical picture on the daily chart.

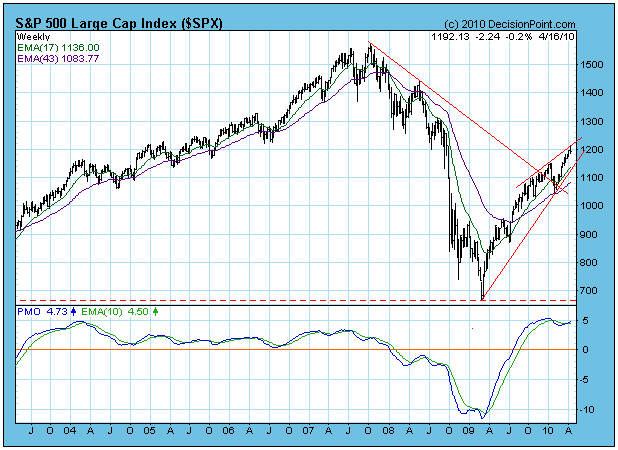
I do have concerns when I look at the weekly chart. Prices are at the top of an ascending wedge formation, and a correction back to the rising trend line seems the most likely next move. Could be that today's decline was the beginning of that correction.

