Technically, this hasn't been brain surgery. Our major indices broke down in early May on very heavy volume and, as technicians, we can never ignore that lethal price/volume combination. The weakness also came on the heels of some of the most extreme complacency that I've seen. When markets get complacent, the risks escalate. It doesn't mean that markets crash and burn. While the breakdown of equity only put call data wasn't provided in 1999 by the CBOE, we can still look at the total put call ratio and see that the market was extremely complacent in 1999 and the market traded higher for months on the heels of it. So clearly, a market doesn't have to fall at the first signs of extreme complacency. But the lessons learned should be obvious. The risks of trading on the long side grow disproportionately to the returns desired. Those risks were realized with the 2000-2002 bear market.
Traders like to trade. That's what they do. But everyone should step back and look at the big picture. We are going through market turmoil unlike anything I've ever seen. We are living through an inherently risky market. Every day. There is much debate, both fundamentally and technically, as to whether the market is heading higher or heading lower. And that debate relates to both the near-term and long-term. This is what makes a market.
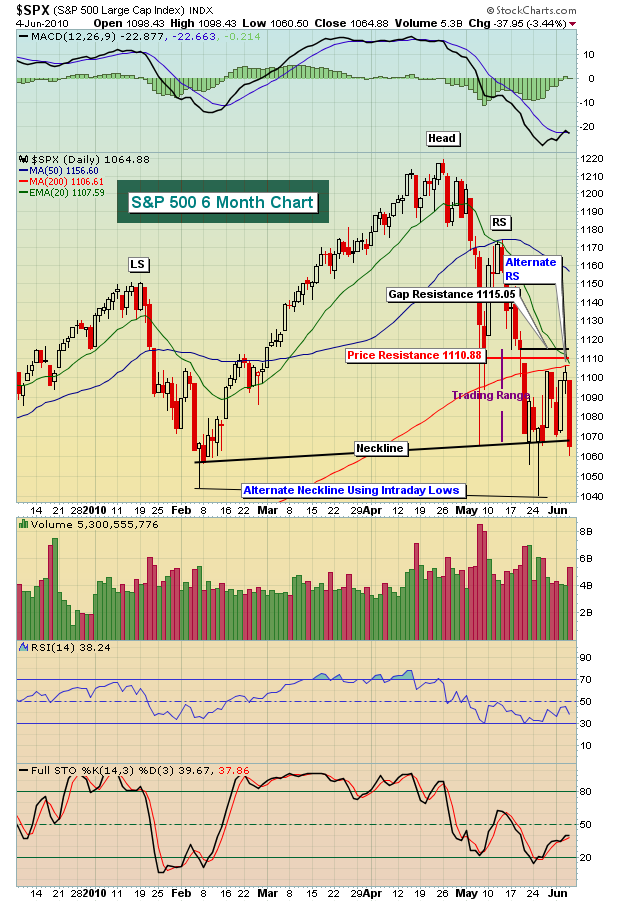
Friday's carnage was felt on every index and every sector. Few stocks were spared. But just two days earlier, we had a robust advance that saw the exact opposite - the overwhelming majority of stocks carried the market higher. There are two primary differences between the two "routs". The biggest, in my view, was the accompanying volume. Friday's selling saw 5.3 billion shares trade on the S&P 500. Let's keep in mind it was a FRIDAY, when volume tends to slow down a bit from previous days. Wednesday's selling saw just a little more than 4.0 billion shares. Panic selling generally sees heavier volume. The problem I have with Friday though is that there should have been little panic. We traded within the same range that we've been trading in for the last couple weeks. We didn't break down on Friday. So why the panic? Well, to me it's a sign that institutions are preparing for a further meltdown in equities.
Let's recap what's transpired in the market to get a better grasp of the overall technical picture. In my mid-April article, I discussed the deteriorating condition of financials on a relative basis and how that was a sign of potential weakness in the major indices. In my early-May article, I noted that both the NASDAQ and Russell 2000 confirmed the bearish action of the financials from a couple weeks earlier. I discussed the relative complacency with Invested Central's members ad nauseum. We saw massive volume accompany the breakdown across all of the major indices. We've seen retests of that breakdown from underneath on lighter volume. We are now in very bearish head & shoulders formations on many indices, sectors and individual stocks. It's all set up for the bears. Now they must deliver. By "delivering", they must execute a breakdown of the current head & shoulders patterns on heavy volume. That's the only ingredient missing. This pattern is not confirmed until the breakdown occurs. So the bulls do have hope, but it seems to me it's dwindling.
Let's look at the pattern on the S&P 500:

Different technicians may view this pattern differently. I consider the first "computer-glitch"-aided selloff to have marked the right side of the neckline and the subsequent bounce to have formed a classic right shoulder test of the 50 day SMA. Friday's move lower on big volume has simply set the table for the bears. The bulls somehow need to defend this neckline support and they must do it NOW. Monday will be interesting both in terms of where we open and then how we react to that open. A tale will likely be told.
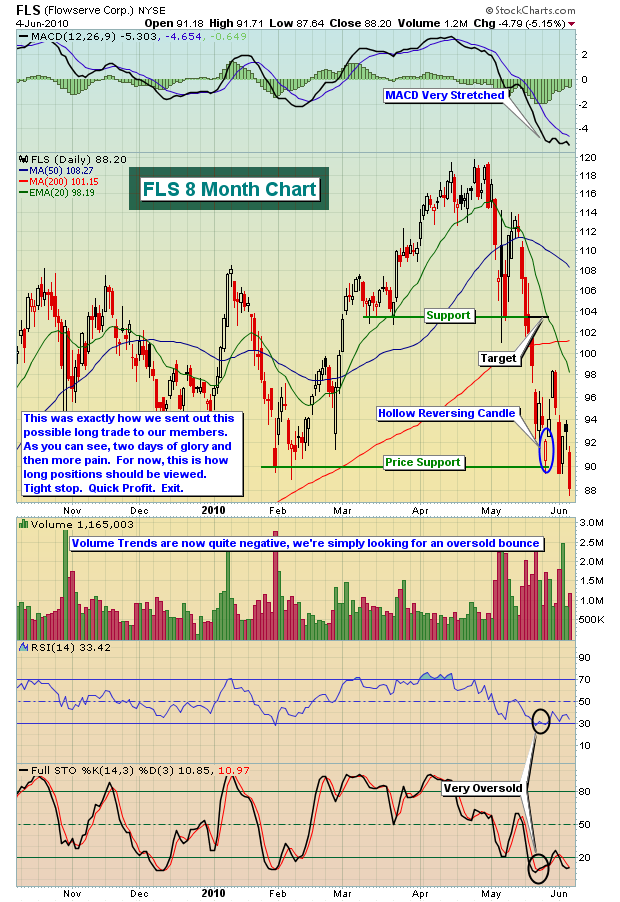
Based on all of this, the big question is.....how do you trade this market? As I've been saying for several weeks, I'd do it with much less frequency, with fewer shares, and my holding period would be very short. I normally favor swing trading, holding onto stocks anywhere from one week to as much as a few months, capturing more reliable moves in a trending market. This market's volatility and inherent risk simply doesn't allow for that strategy, period. Understanding the market environment is the first step in successful trading. I'd be tempted to trade (short) only off of breakdowns occurring on heavy volume or light volume retracements to key resistance areas. On the long side, you have to wait for reversing candles to occur at key support and then be sure to keep a tight stop in place and take profits quickly. Here's an example of a recent long trade that we highlighted for members on Flowserve (FLS):

For Monday, we're highlighting our daily Chart of the Day, focusing on another reversing candlestick. Hopefully, we'll have the opportunity for a quick gain as well. This chart can be accessed by CLICKING HERE.
Happy trading!
