ChartWatchers August 21, 2010 at 03:03 PM
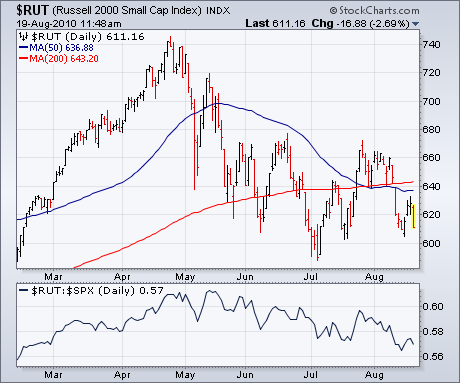
It's usually a bad omen for the market when small caps and technology stocks are underperforming -- as they're doing at present. Chart 1 shows the Russell 2000 Small Cap Index trading closer to its July low than its July high... Read More
ChartWatchers August 21, 2010 at 02:53 PM
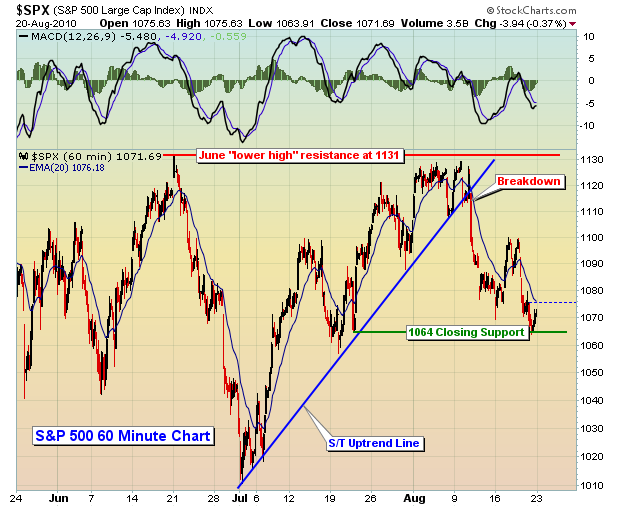
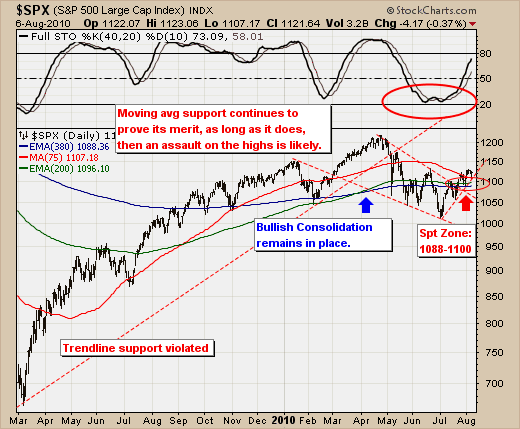
With a myriad of "under the surface" problems, the S&P 500 simply ran out of gas at a very inopportune time. The bulls were on the threshold of a major breakout on the S&P 500 above its June highs near 1131... Read More
ChartWatchers August 21, 2010 at 02:46 PM
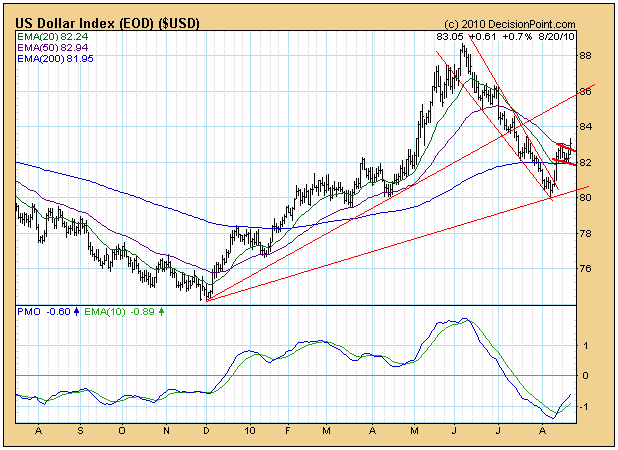
Looking at a weekly chart of the U.S. Dollar Index we can see that it entered a steep correction off the June top when it encountered long-term resistance from a declining tops line reaching back to 2006... Read More
ChartWatchers August 21, 2010 at 06:46 AM
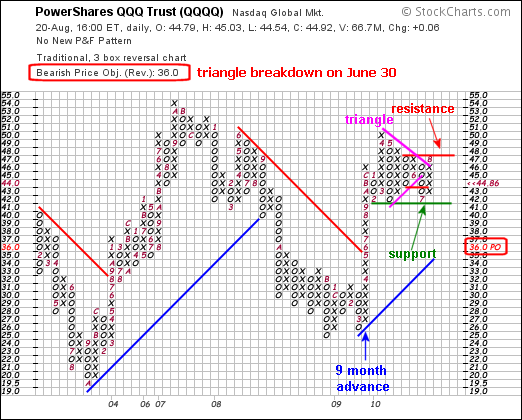
The Point & Figure chart for QQQQ shows clear support and resistance lines for 2010. The ETF advanced for 9-10 months with a long column of X's in 2009 and then embarked on a consolidation in 2010. Notice that the X's started in March 2009 and continued until December... Read More
ChartWatchers August 20, 2010 at 08:29 PM

Hello Fellow ChartWatchers! It's that time of year again: Now through the end of August, StockCharts.com is running it's "End-of-Summer-Almost-Fall" special and this is a very special special indeed... Read More
ChartWatchers August 07, 2010 at 09:00 PM
Yep, you read the headline correctly. I want to personally congratulate you if you're able to successfully trade this market. Because it ain't easy. Friday was yet another example... Read More
ChartWatchers August 07, 2010 at 07:29 PM
Hello Fellow ChartWatchers! The market is trying to rise but bearish news keeps beating it down... Read More
ChartWatchers August 07, 2010 at 06:13 PM
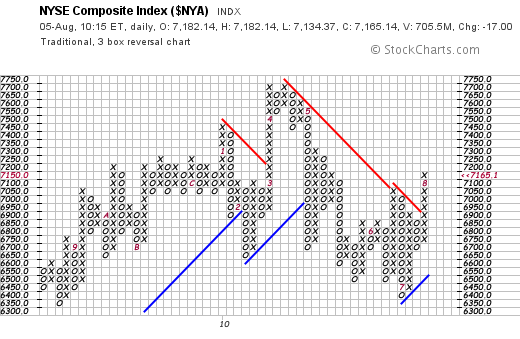
One of the things I like best about poing & figure charts is their simplicity. Their strongest feature is that buy and sell signals are easier to spot than on bar or candlestick charts. A p&f chart shows alternating columns of X's and O's... Read More
ChartWatchers August 07, 2010 at 06:05 PM
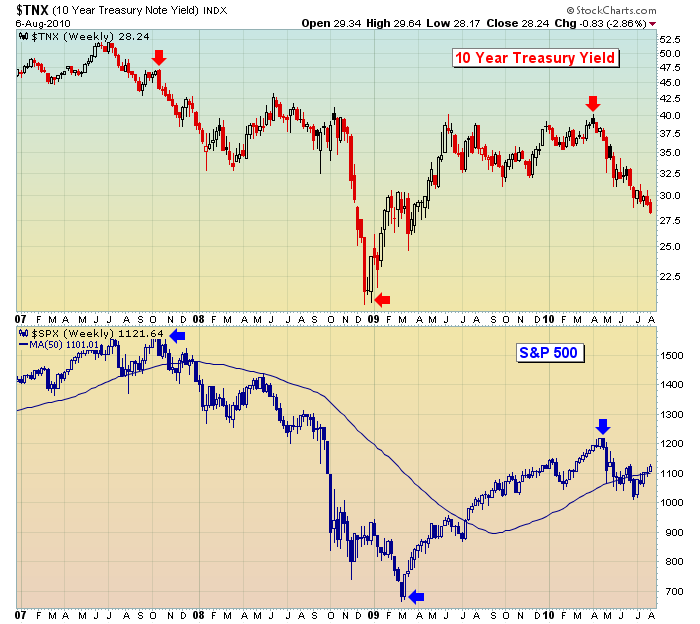
The rally off the July low is ongoing, and appears resilient in the face of very negative sentiment. While we want to be bearish based on a plethora of macro fundamentals, the technical viewpoint remains rather bullish for the time being... Read More
ChartWatchers August 07, 2010 at 05:55 PM
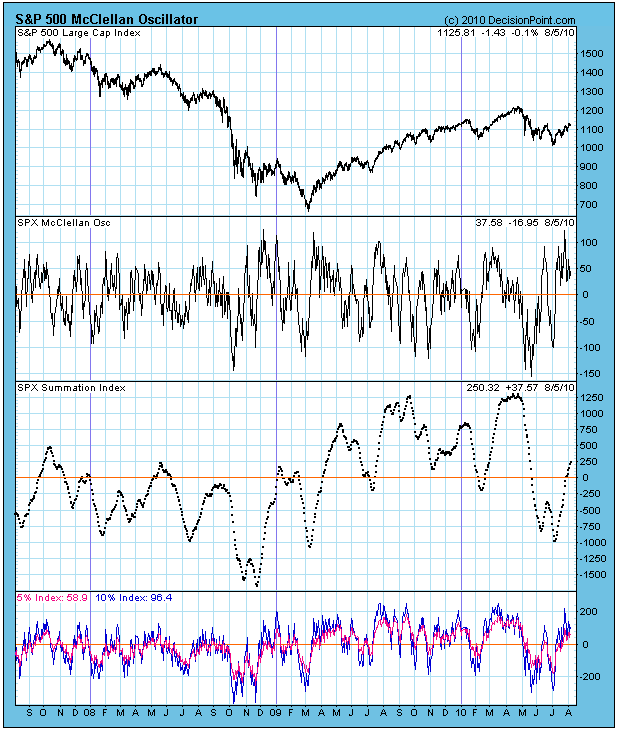
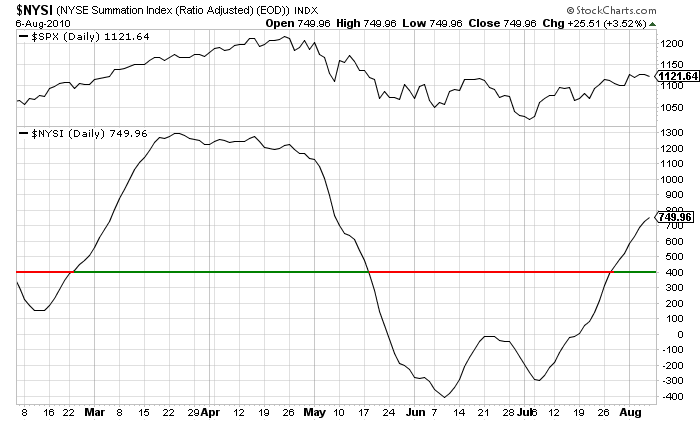
The McClellan Oscillator chart could be voted one of the most likely charts to cause the glazing over of multitudes of eyeballs; however, with a little effort you can understand it and appreciate the wealth of information it conveys... Read More
ChartWatchers August 06, 2010 at 10:08 PM
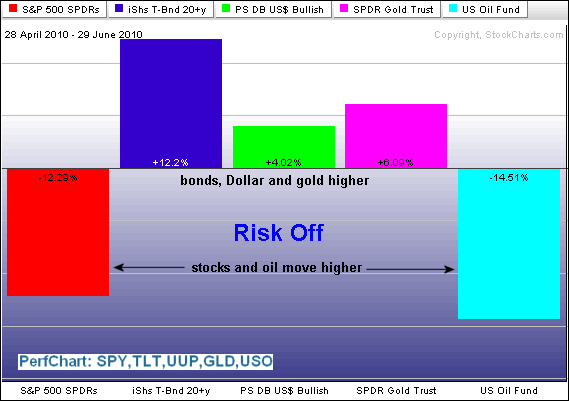
The intermarket picture shows a preference for the risk-on trade over the last five weeks. The next two PerfCharts show five intermarket ETFs over two distinct timeframes. The first extends from late April until late June, which is when stocks declined sharply... Read More