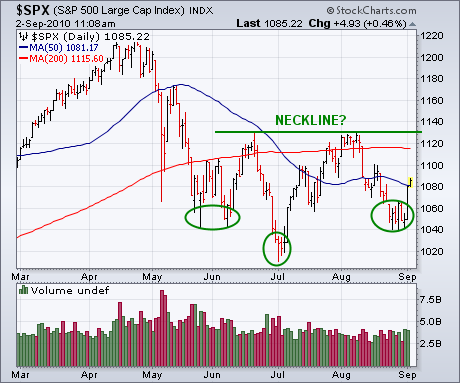
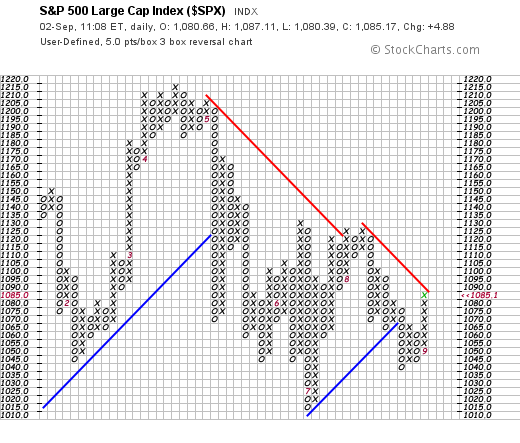
Today's message is going to represent a shift in emphasis in favor of stocks. As you know, I've been writing since the spring about the huge move into bonds and out of stocks owing to fears of economic slowdown and deflation. I've also written in the past (June 17 to be exact), however, that a four-year cycle bottom is due sometime during the second half of this year. Although that four-year bottom usually kicks in during October, the last one (2006) took place during July and August (so it can happen earlier). It's also well known that September and October can be especially dangerous months. Having said that, one of the main reasons why I'm now leaning toward the view that this year's four-year bottom may occur sooner is the presence of so many potential "head and shoulder" patterns that are visible on stock charts. The S&P 500 is an excellent example of one. First a review of what a "head and shoulders" bottom looks like. It consists of three prominent lows (see circles) with the middle low (the head) slightly lower that the two surrounding lows (shoulders). Another feature of the H&S is that the right shoulder (the August low) often finds support at the same level as the left shoulder (May/June low). Another feature is a "neckline" drawn over the two previous highs (formed during June and August). Chart 1 is almost a textbook example of what that bottoming formation looks like. To actually complete a H&S bottom, however, prices need to close above the neckline. That's along ways off. However, it's not soon to consider the possibility that the market may be heading in that direction. Yesterday's explosive rally has already given a short-term buy signal. That can be seen in the point & figure boxes in Chart 2. By combining that possibility that a H&S shoulder is forming with the likelihood for a four-year cycle bottom during the second half of this year, I don't think it's too soon to start reallocating some funds out of bonds (or cash) and back into stocks.


