It's been a breathtaking move. The NASDAQ was trading near the 2100 level at the end of August. Friday it closed at 2579. That's more than a 25% move in just over two months. Of course that followed a 17% decline from April through August. The bottom line is this: The NASDAQ is approximately 2% higher than it was at the April high. The Dow Jones is also roughly 2% higher since April. The S&P 500 and Russell 2000 are closer to breakeven.
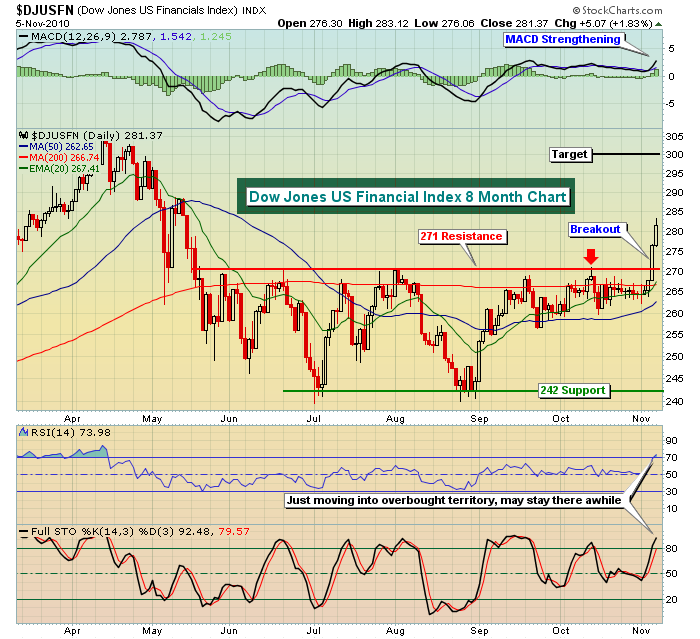
Here is the good news - the financials broke above key resistance as the Dow Jones US Financial Index ($DJUSFN) finally broke above that 271 level. Right on cue, financials led on a relative basis last week and pulled the major indices higher with it. That 271 level now becomes excellent support. Until the bears can tear down support on the financials at that level, you've got to be long the group. We saw what happened to semiconductors when resistance was initially cleared. They exploded and so did the NASDAQ and NASDAQ 100. Now it's the financials' turn. We're not sure that the major indices will fly from current levels, but we do expect dollars that rotate out of other sectors to find a home in financials. That should spell solid outperformance in the near-term, at a minimum.
Check out the chart below:
Financials were stuck in a 242-271 trading range. The breakout measures initially to 300 and we wouldn't be surprised to see the group rise in the short-term to that level. The new trading range is 271-300. Based on this range, the current reward to risk is nearly 2 to 1. We like the odds of being long this group, especially on any pullback near 271.
Ok, that's the good news. The bad news is that folks are actually beginning to believe in this rally. Complacency can derail a bull run and we're showing early signs of exactly that. I measure complacency using the relationship between equity calls and equity puts traded. The psychological state of the retail trader can be seen by this ratio and by the contract volume. Complacency was highly prevalent in April and was one of several reasons why I believed the market was topping. Recently, as the market was approaching key resistance levels, I commented to members that the resistance was more likely to be taken out due to the lack of complacency. In other words, there was little belief by the retail trader that the market could go higher. That non-committal to call options was at least one reason why the market did break out. But now the optimism is building. My focus on the equity only put call ratio (EOPCR) is the subject of Monday's Chart of the Day. CLICK HERE to view the annotated chart and to listen to the video version.
There have been many technicicans who've felt the market was too overbought to continue moving higher over these past few weeks. The current RSI and stochastics readings on the S&P 500 are at 79 and 99, respectively. That's EXTREME overbought territory and means the market has to move lower, right? Not necessarily. RSI and stochastics serve very useful purposes, but identifying the type of market is the first step in determining how much to rely on RSI and stochastics. Overbought can remain overbought for long periods of time. It varies depending on the market. Our next Online Trader Series event, scheduled for this Thursday at 4:30pm EST, will feature the best ways to utilize RSI and stochastics in your trading strategy. I'll be happy to show you when you can least rely on these two momentum indicators. CLICK HERE for more information on this event.
Happy trading!

