In my business I am exposed to the writings of a lot of really smart people, and it is never hard to find a few who are trying to explain to us why the market is wrong. The market is wrong, of course, because it has blithely gone its merry way without any regard for the brilliant analysis, presented by the writers -- analysis that explains with exquisite detail and flawless logic why the market should be doing the exact opposite of what it is doing.
Fundamental analysts are most prone to this kind of error -- writing reams of research, and then, by god, sticking to their guns as the market in turn puts them and their investors through a meat grinder. Most are trapped in a system where they are required to justify their actions with a good fundamental story, which is why, for example, Calpers (the State of California retirement system) was down 25% in 2009.
However, there are plenty of technicians who fall into the same trap when they start using indicators and oscillators as a crystal ball. This approach usually doesn't work any better than the fundamental crystal ball. You are basically left with a bunch of ambiguous technicals as a basis for making your next "call."
Rather than explaining why the market is wrong, we should be asking, "What is the market doing?", and acting appropriately. I am, of course, talking about a trend-following discipline. This approach is never perfect, but it is always rational because we respond to what prices are actually doing, not what we think they ought to be doing.
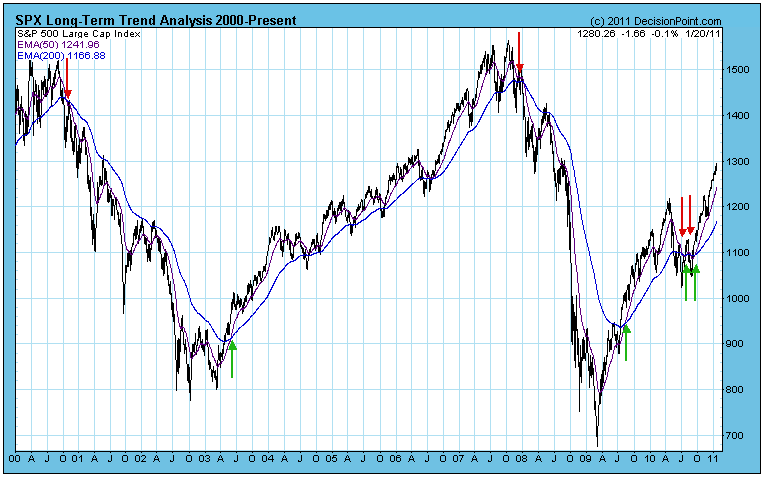
This article is not intended to explain our entire Trend Model methodology, just to plant a seed that maybe following the market is better than telling the market where it should go. Below is a chart displaying our Long-Term Trend Model. It generates a buy signal (green arrow) when the 50-EMA crosses up through the 200-EMA, and a sell signal (red arrow) when the opposite occurs. As you can see, it has been very timely and effective for most of the eleven years shown. You can also see imperfection when we got some whipsaw signals in 2010. Whipsaw is painful, but not nearly as painful as being caught on the wrong side of the market for an extended period. I just think of it as a cost of doing business. (The long-term component of the Trend Model is on a BUY signal as of 9/17/2010.)
There is another positive aspect to committing to a trend-following discipline in addition to ease of decision-making. When you are making discretionary decisions based upon some fundamental or technical theory, you are inevitably faced with having made a "call" and having the market go against you. What to do now? Change your position and risk whipsaw? Hang tough and hope the the market finally goes your way? Been there, done that. With trend following, your decisions are made for you, and position changes are based on objective reasons.
Unfortunately, most money managers do not use the trend-following methodology. Fortunately, it isn't hard to do, and you can do it yourself with not a lot of effort.
We have created a series of charts for our subscribers that specifically addresses the 20-EMA and 50-EMA relationship going back to the 1920s. You will see, as I said before, that it is not perfect, but you can also see that it is always adjusting to changing markets, and is overall very effective.
It is important to note that the 50/200-EMA model is used in our work to establish the long-term context of the market -- bull market or bear market. It responds slowly and will not react quickly enough to avoid something like the 1987 Crash. Our standard Trend Model is designed for shorter timeframes.

